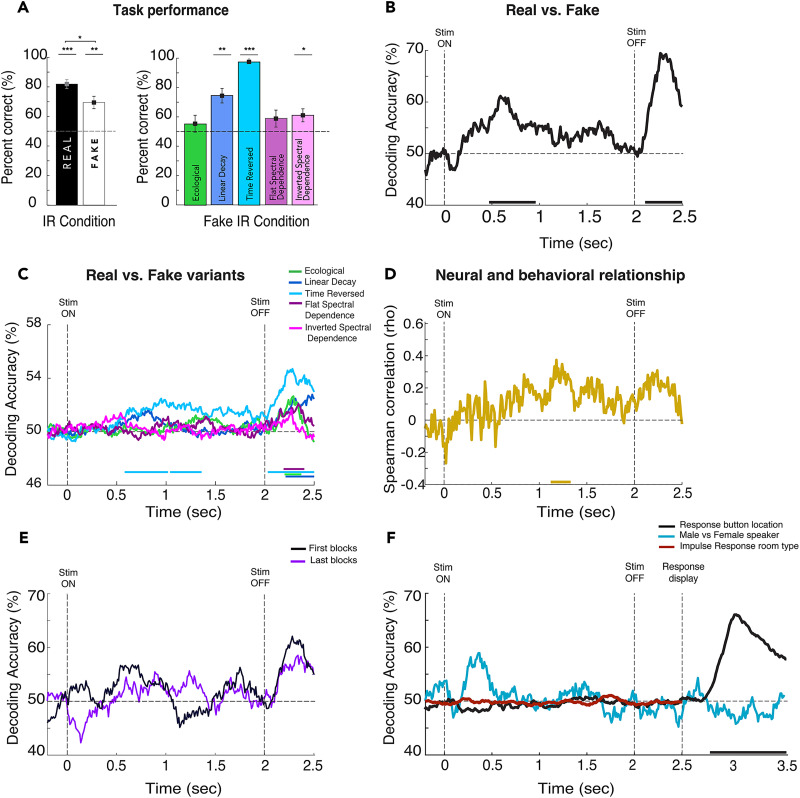
Figure 2.
Behavioral and neural signatures of reverberant perception. A, Group-level performance (mean accuracy ± SEM across participants) for real and fake trials overall and broken down by synthetic variants. B, Real versus fake average decoding time courses across subjects. C, Decoding time courses of real versus fake variants averaged across subjects. The vertical dashed lines at zero and 2 s indicate the stimulus onset and offset, respectively; the horizontal dashed line indicates the decoding percentage at the chance (50%); and the horizontal colored bars in the x-axis indicate significance. D, Time course of brain–behavior correlation (Spearman’s correlation, rho) relating pairwise decoding of real and fake variants (panel C) to each participant's behavioral performance (panel A). E, Decoding accuracy time courses for the first 5 blocks of trials (black) versus the last 5 blocks of trials (violet). F, Decoding time courses for trials labeled by response button location (black), speaker gender (Male vs Female; cyan) and Impulse Response Time (red). For all statistics, N = 20; t test against 50%; cluster-definition threshold, p < 0.05; 1,000 permutations. *p < 0.05; **p < 0.01; ***p < 0.001.

