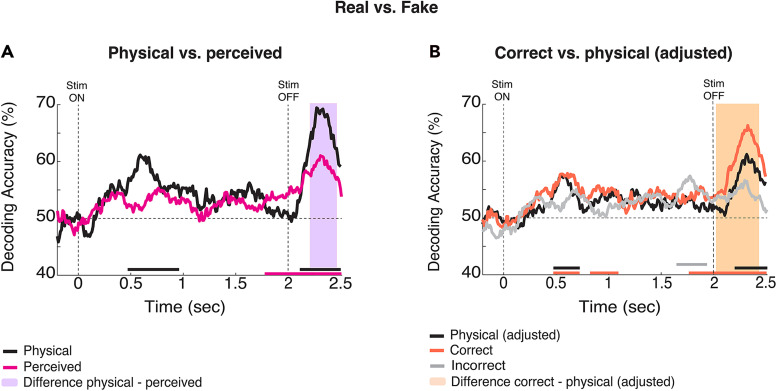
Figure 3.
Neural signatures of reverberation perception. A, Decoding accuracy time courses for real versus fake trials labeled by physical (black line) and perceived (pink line) categories. The vertical dashed lines at 0 and 2 s indicate the stimulus onset and offset; the horizontal dashed line indicates chance (50%), and color-coded bars in the x-axis indicate significance. The violet area denotes the time when the physical and perceived decoding differed. B, Real versus fake decoding accuracy for correct (orange) and incorrect (gray) trials, compared against physical (black) adjusted to match trial count for correct condition. For all statistics, N = 20; t test against 50%, cluster-definition threshold, p < 0.05; 1,000 permutations. For incorrect response trials, N = 18 because two subjects did not have sufficient real incorrect trials.

