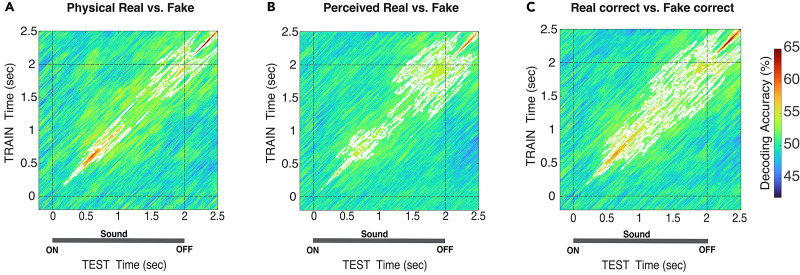
Figure 4.
TGM of real versus fake decoding according to physical stimuli, perceptual report, and correct response. A, Physical real versus physical fake. B, Perceived real versus perceived fake. C, Real correct versus fake correct. White contours indicate significant clusters across subjects and dashed lines at 0 and 2 s indicate the stimulus onset and offset. For all statistics, N = 20; t test against 50%, cluster-definition threshold, p < 0.05; 1,000 permutations.

