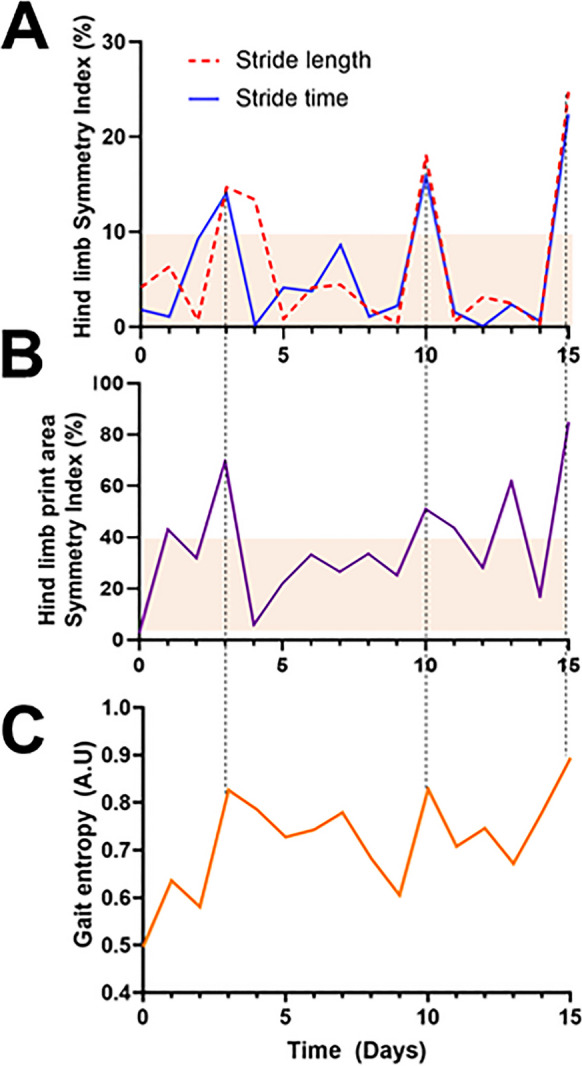
Fig. 4.

Temporal dynamics of gait alterations following hypertension induction in mice. A Day-to-day variations in hind limb stride length and stride time symmetry indices after hypertension induction, highlighting temporary surges in interlimb gait asymmetry lasting 1–2 days. This analysis corresponds to the same mouse whose brain, exhibiting cerebral microhemorrhages, is presented in Fig. 2. B Day-to-day fluctuations in the hind limb paw print area symmetry index following hypertension induction, illustrating periods of print area asymmetry that coincide with the surges observed in SL and ST asymmetry. C Day-to-day changes in gait entropy following hypertension induction, with evident increases corresponding to periods of increased gait asymmetry, providing insights into the temporal dynamics of CMH-induced subclinical neurological symptoms
