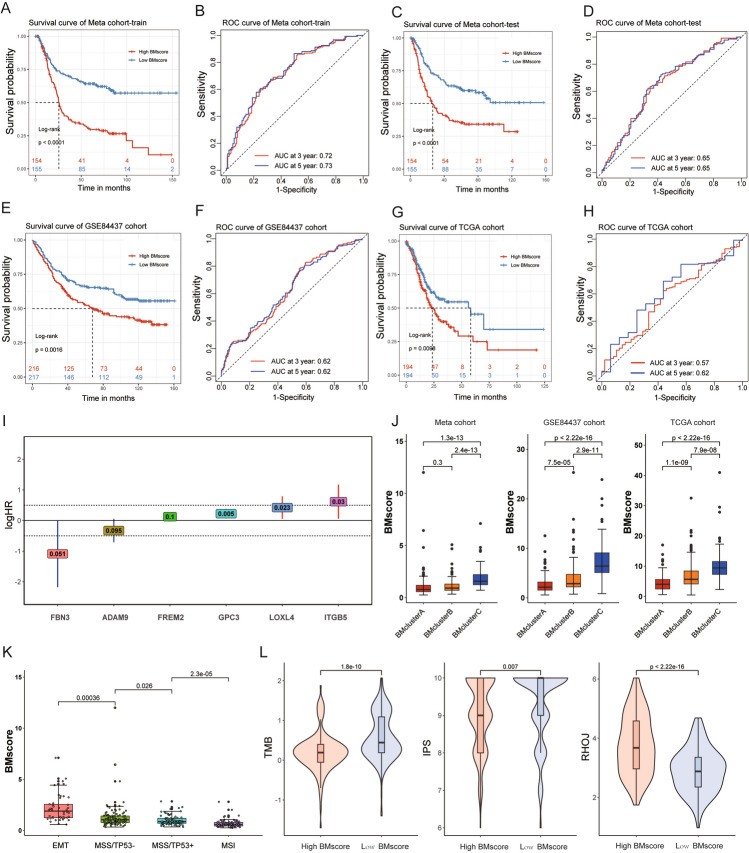
Fig. 6.
Construction of BM prognostic risk model for GC. A, KM survival curves for the high and low BMscore groups in the training set of the Meta cohort. B ROC curves for the training set of Meta cohort. C KM survival curves for the high and low BMscore groups in the validation set of the Meta cohort. D ROC curves for the validation set of Meta cohort. E KM survival curves for the high and low BMscore groups in the GSE84437. F ROC curves of GSE84437.G: KM survival curves for the high and low BMscore groups in the TCGA cohort. H ROC curves of TCGA cohort. I the Hazard ratio for the six genes used to construct the multivariate COX proportional risk regression model. J BMscore for BMclustrA/B/C subtypes in the Meta cohort, GSE84437 cohort, and TCGA cohort. K BMscore for the four ACRG subtypes of GC, including EMT, MSS/TP53 + , MSS/TP53-, and MSI

