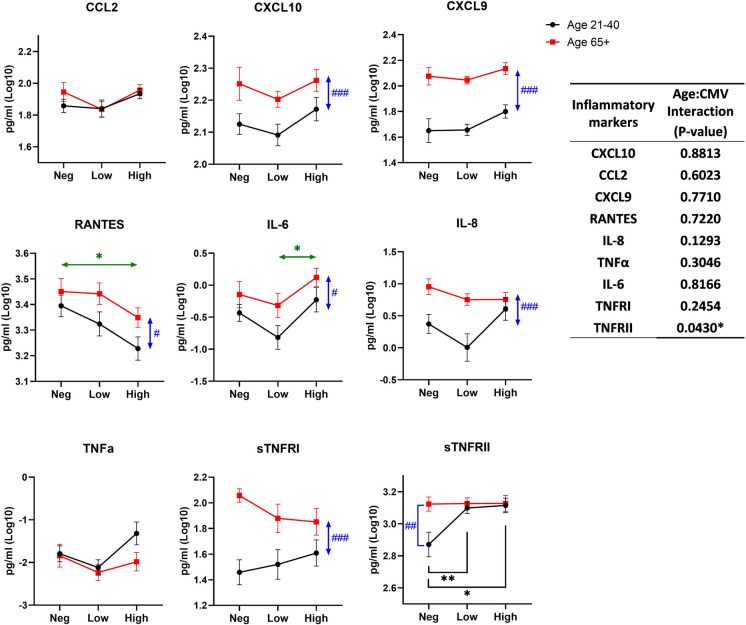
Fig. 2.
Effect of age and CMV serostatus on inflammatory markers in plasma. The interaction of age and CMV serostatus for each inflammatory marker level in plasma is analyzed by ANOVA (inset table). Data are presented as mean ± SE. Black circle and line, age 21–40; red square and line, age 65 + . Neg, anti-CMV antibody negative; low, anti-CMV antibody titer low; high, anti-CMV antibody titer high. Vertical double-head arrows (blue) represent the comparison between age groups regardless of CMV status and horizontal double-head arrows (Green) represent the comparison between CMV groups regardless of age. p-values for group comparisons were adjusted by Holm’s method. Statistical significance between age groups is shown as #p < 0.05, ##p < 0.01, and ###p < 0.001. Statistical significance between CMV groups is shown as *p < 0.05, **p < 0.01, and ***p < 0.001

