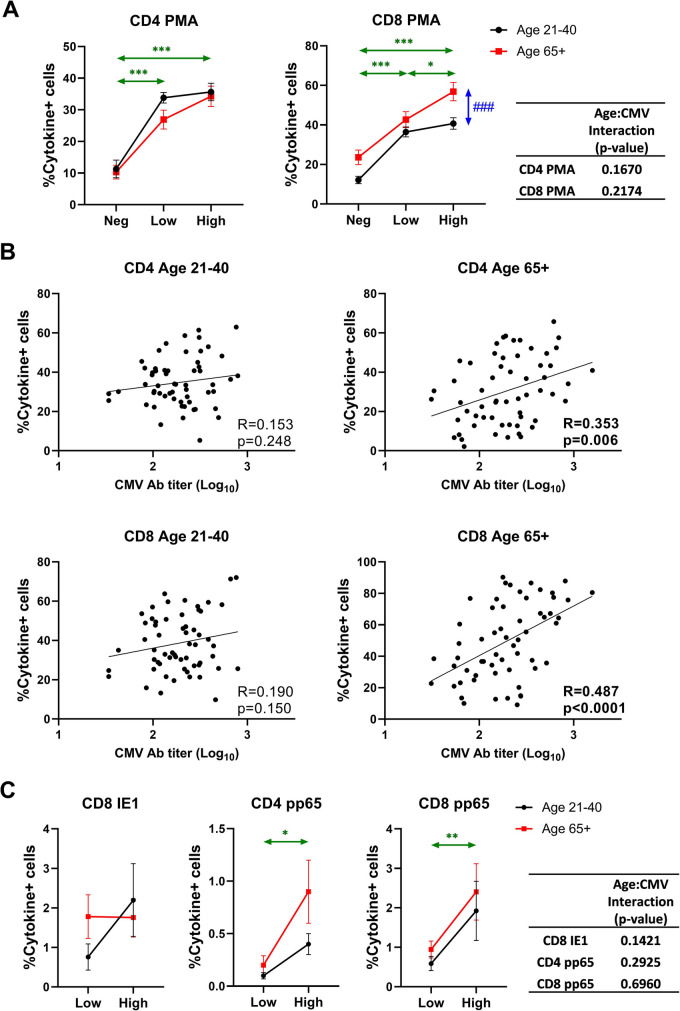
Fig. 6.
Effect of age and CMV serostatus on non-specific and CMV-specific T cell response. PBMCs were stimulated by PMA/ionomycin or CMV peptides and IFN-γ and TNF-α positive cells were quantified by intracellular staining followed by flow cytometry. Cytokine + cells are defined by IFN-γ + and/or TNF-α + cells. A Effect of age and CMV serostatus on non-specific T cell response. B Correlation analysis between CMV antibody titer and frequency of cytokine + cells in CD4 or CD8 of different age groups. Pearson’s R and correlation p-values are shown at the bottom right corner of each scatter plot. C Effect of age and CMV serostatus on CMV-specific T cell response. A and C Black circle and line, age 21–40; red square and line, age 65 + . Neg, anti-CMV antibody negative; low, anti-CMV antibody titer low; high, anti-CMV antibody titer high. Vertical double-head arrows (blue) represent the comparison between age groups regardless of CMV status and horizontal double-head arrows (Green) represent the comparison between CMV groups regardless of age. Data are presented as mean ± SE. The interaction of age and CMV serostatus for frequency of cytokine + cells in CD4 or CD8 T cells is analyzed by ANOVA. p-values for group comparisons were adjusted by Holm’s method. Statistical significance between age groups is shown as #p < 0.05, ##p < 0.01, and ###p < 0.001. Statistical significance between CMV groups is shown as *p < 0.05, **p < 0.01, and ***p < 0.001

