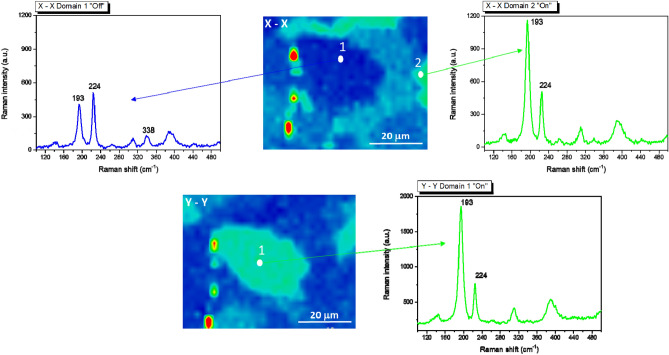
Figure 3.
Crystal grain orientation dependence of the Polarized Raman maps. The maps are collected on the very same region by changing the polarization of the excitation laser and controlling the polarization at the detector. Top Panel: the spectrum collected on the central domain, named 1 in the X-X map and appearing “Off” (blue), is reported on the left. The spectrum collected on the lateral domain, named 2 and appearing “On” (green), is reported on the right. Bottom Panel: the central domain 1 turns “On” when inverting the polarization, in the Y–Y image.

