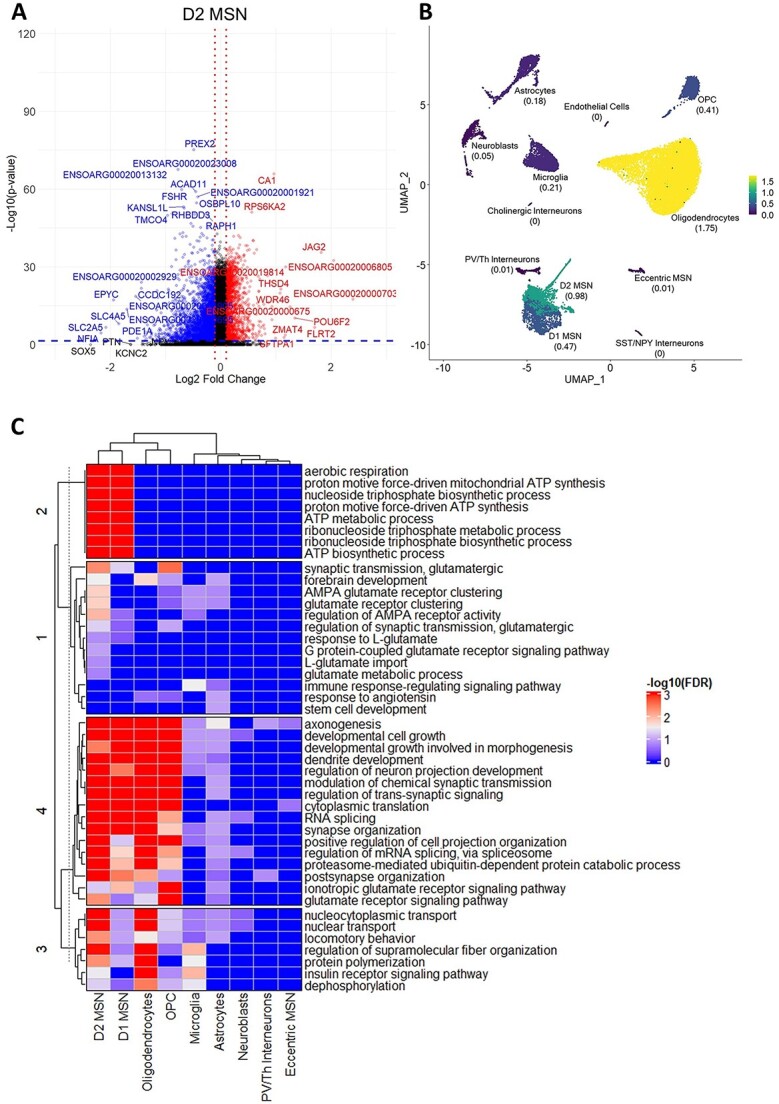
Figure 2.

Differentially expressed genes in OVT73 versus control sheep striatum. (A) Volcano plot of differentially expressed genes (DEGs) identified in D2 medium spiny neurons (OVT73 D2 MSN vs control D2 MSN). Horizontal blue line shown at P = 0.05, vertical red lines shown at log2 fold change of −0.1 and 0.1. (B) Proportion of DEGs over the median number of expressed genes in each cell type. (C) Heatmap of most significant gene ontology terms (ordered by lowest FDR adjusted p-values) in cell types.
