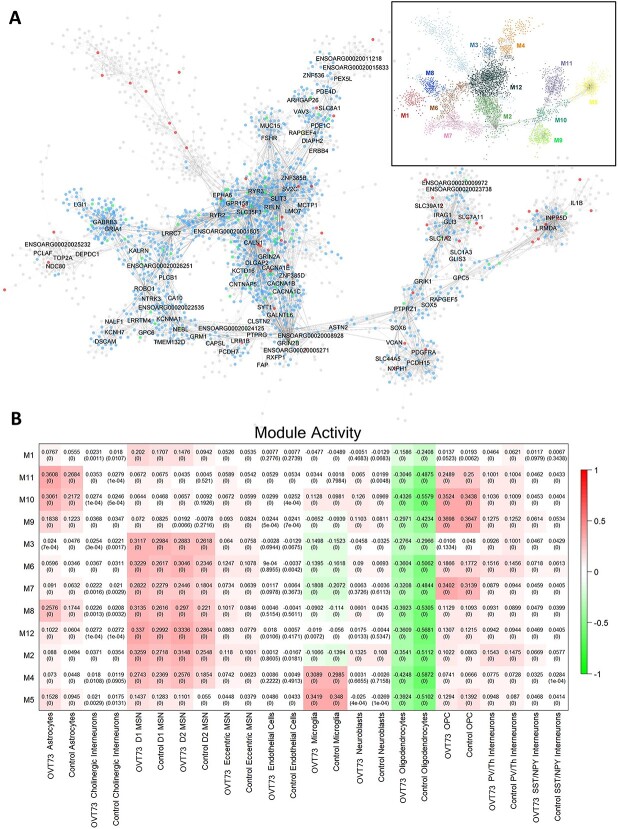
Figure 3.
Co-expression gene modules. (A) Co-expression modules generated using the multiscale embedded gene Co-expression network analysis (MEGENA). A total of 12 modules were identified with the structure outlined in the top right. module hub genes are labelled with connected genes represented as dots. Genes differentially expressed between OVT73 and controls are coloured in blue. Genes with evidence to support an interaction with HTT as curated by the HDinHD database [38] were coloured in red. genes that were both differentially expressed and a known HTT interactor were coloured in green. (B) Co-expression module activity in OVT73 and control cell types. Module activity in cell types were determined by computing the module eigengene (first principal component) using normalised expression values of module genes. Eigengene values are shown with p-values of the correlation shown in parentheses in each square. Higher eigengene values indicate higher gene expression of module genes within the cell type.

