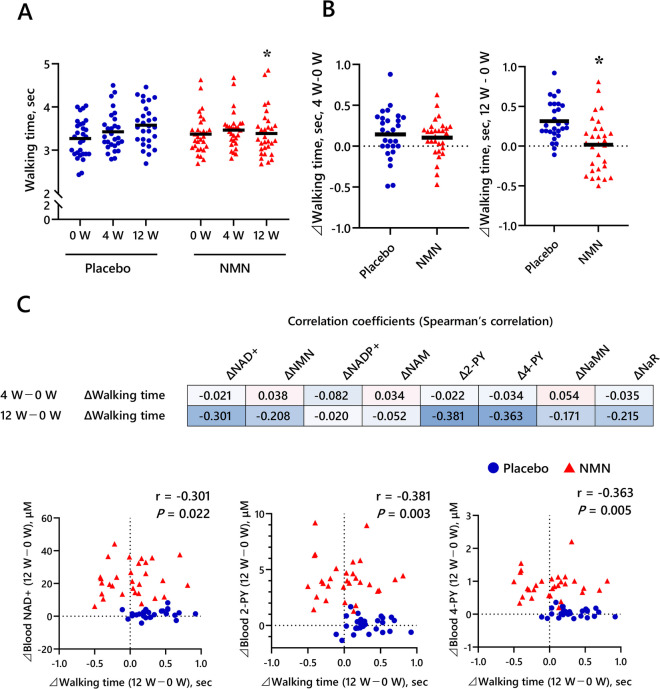
Fig. 2.
Effect of NMN supplementation on 4-m walk time and NAD + metabolites. A Results of 4-m walk test for placebo and NMN groups at week 0 (0W) and at weeks 4 (4W) and 12 (12W) of the study period. B Change in the 4-m walk time from 0 to 4W and 12W of the study period. Black horizontal lines indicate average values. *P < 0.05 vs. Placebo group. Results of ANCOVA with 0 week as the covariate. C Upper diagram: Spearman’s correlation between change in 4-m walk time and change in NAD + metabolites from 0W and at 4W and 12W of the study period. The numbers indicate the correlation coefficients. Lower diagram: Spearman’s correlation between change in 4-m walk time and change in NAD + , 2-PY, and 4-PY from 0W and at 12W of the study period. NAD + nicotinamide adenine dinucleotide, NMN nicotinamide mononucleotide, NADP + nicotinamide adenine dinucleotide phosphate, NAM nicotinamide, 2-PY N1-methyl-2-pyridone-5-carboxamide, 4-PY N1-methyl-4-pyridone-3-carboxamide, NaMN nicotinic acid mononucleotide, NaR nicotinic acid riboside

