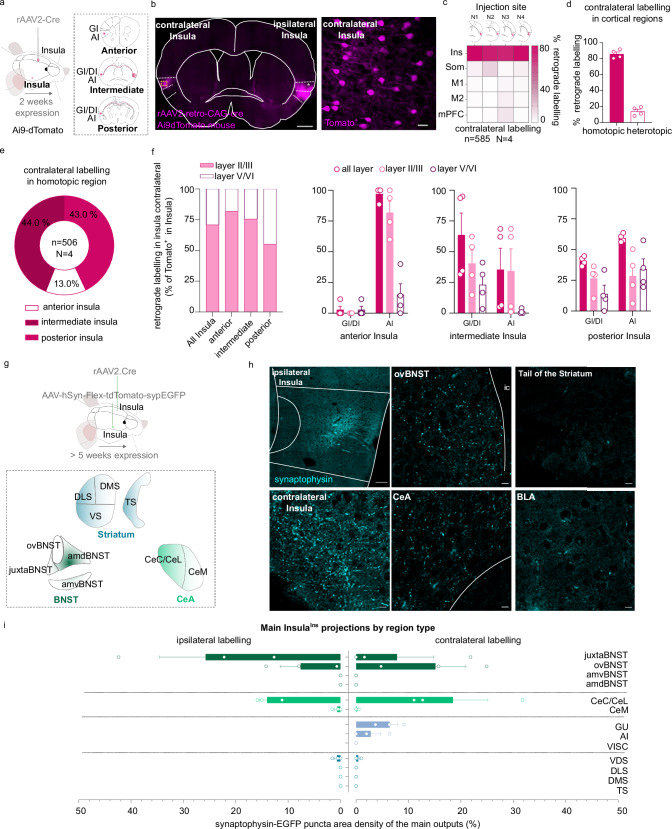
Fig. 1. Anatomical characterization of an Insula interhemispheric neuronal subpopulation.
a, g Experimental design. b Representative epifluorescent image of a coronal slice of brain injected with a rAAV2-retro-CAG-Cre retrograde virus in the ipsilateral insula in Ai9-dTomato mouse (scale 500 µm) with a high magnification of contralateral labeling in Insula (example of the mouse N2, scale 25 µm). c, d Quantification of contralateral labeling in Insula (homotopic labeling) and other cortical regions (heterotopic labeling) in 4 mice (N1, N2, N3, N4). e, f Quantification of contralateral labeling in the homotopic Insula subregions (e), and layers (f) (n = 506 neurons, 4 mice). h, i immunofluorescence confocal images showing the InsulaIns main projections identified by synaptophysin-eGFP puncta(h) and its quantification (i) (N = 3 mice). amdBNST anteromedialdorsal bed nucleus of the stria terminalis, amvBNST anteromedialventral bed nucleus of the stria terminalis, ovBNST oval-BNST, juxta-BNST juxtacapsular BNST, a.c. anterior commissure, cc corpus callosum, BLA basolateral amygdala, CeC/CeL central and lateral part of the central amygdala, CeM medial part of the central amygdala, DLS dorsolateral striatum, DMS dorsomedial striatum, VS ventral striatum, TS tail of the striatum, Ins Insula, Som Somatosensory cortex, M1 primary Motor cortex, M2 secondary Motor cortex, mPFC medial Prefrontal cortex, n number of neurons, N number of mice. Data are presented as mean values ± SEM.

