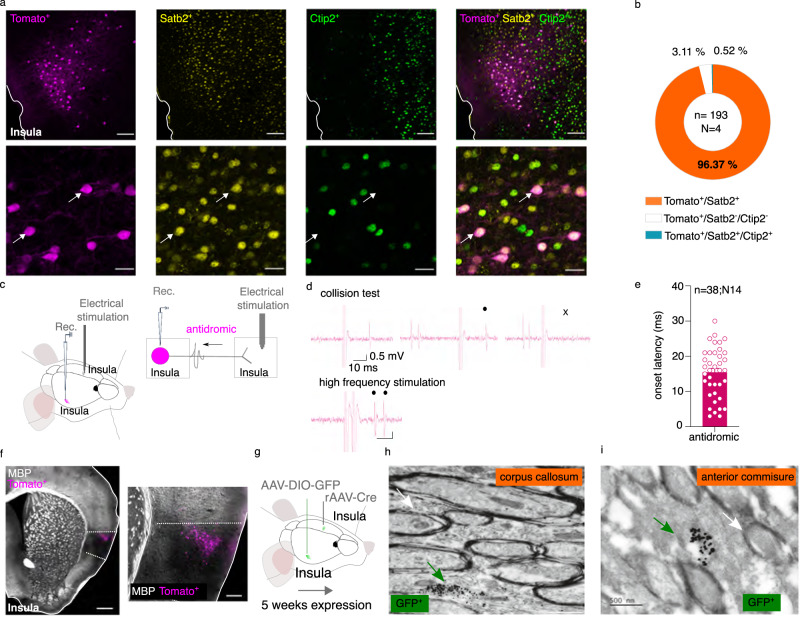
Fig. 2. Molecular and electrophysiological characterization of InsulaIns neurons.
a Immunofluorescence confocal images showing InsulaIns neurons (tomato labeling), insula Satb2 staining (yellow labeling), insula Ctip2 labeling (green labeling), and the overlay at low (top, scale 100 µm) and high magnification (bottom, scale 25 µm). At the bottom, white arrows show examples of Tomato and Satb2 colocalizations. b Quantification of Tomato, Satb2, and Ctip2 colocalization in the Insula. c, g Experimental design. d Representative traces showing a collision test and a high-frequency stimulation protocol for an Insula interhemispheric neuron projecting to the other Insula. e Histogram of the onset latency of Insula antidromic responses. f Representative epifluorescent image at low (left, scale bar 500 µm) and high magnification (right, 150 µm) of MBP staining (gray labeling) and InsulaIns neurons (tomato labeling, N = 3 mice). h, i Representative image obtained with electron microscopy showing immunogold GFP labeling of unmyelinated InsulaIns axons passing through the corpus callosum (h) or the anterior commissure (i) (green arrow, N = 4 mice). The white arrow shows an example of a myelinated axon (scale 500 nm). Rec recording, MBP myelin basic protein, n number of neurons, N number of mice. Data are presented as mean values ± SEM.

