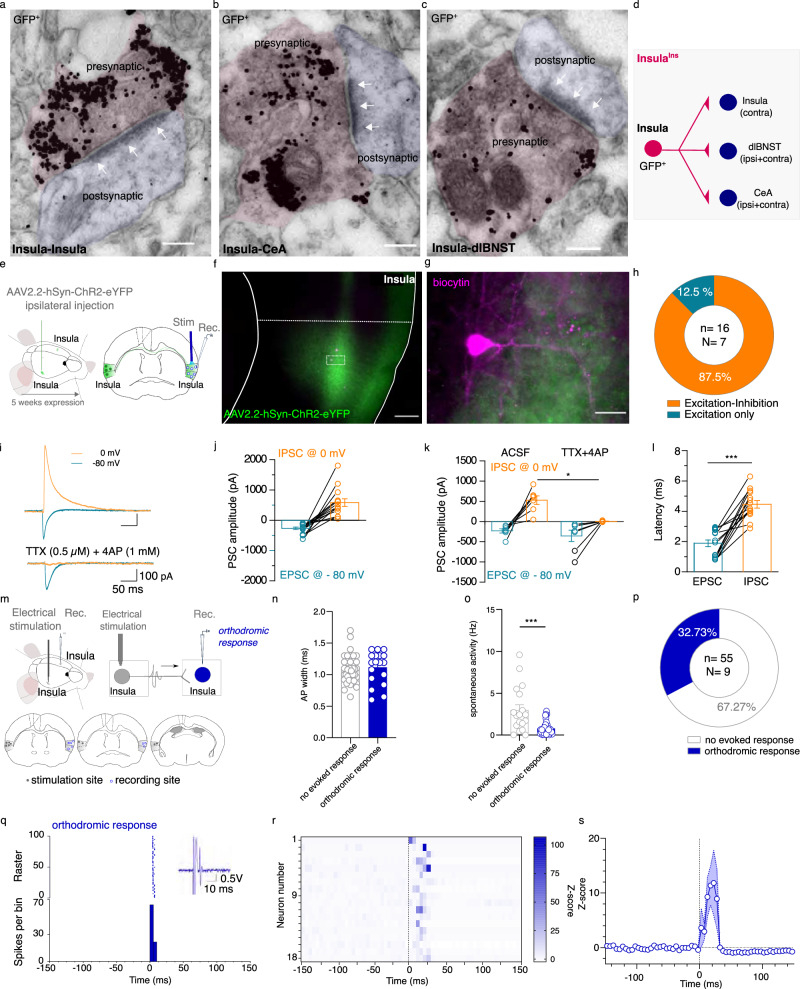
Fig. 3. Functional characterization of InsulaIns circuit.
a–c Representative images of immunogold GFP labeling obtained with electron microscopy showing asymmetric synapses (at white arrows) for Insula to Insula synapses (a), Insula to CeA synapses (b), and Insula to dlBNST synapses (scale bar: 150 nm, N = 4 mice). d Schematic representation of insula interhemispheric circuit. e Ex vivo electrophysiological experimental design. f, g Representative example of a histological control showing insula fibers expressing the Channelrhodopsin (green labeling) projecting to the contralateral insula and insula recorded neurons filled with biocytin (tomato labeling) at low (f, scale bar: 150 µm) and high magnification (scale bar: 25 µm). h Quantification of contralateral Insula pyramidal neuron responses to ipsilateral insula optogenetic stimulation. i Representative traces of evoked ESPC recorded at −80 mV and IPSC recorded at 0 mV in Insula pyramidal neuron before (top) and after TTX + 4AP bath application (bottom). j, k Group mean of evoked PSC amplitude of Insula pyramidal neurons (j) and after TTX + 4AP (k, IPSC amplitude aCSF vs TTX + 4AP: Wilcoxon test W = 21, p = 0.0313; EPSC amplitude aCSF vs TTX + 4AP: Wilcoxon test W = 1; p > 0.05). l Group mean of PSC response latency of Insula pyramidal neurons (Mann–Whitney test U = 2, p < 0.0001). m Experimental design (top) and cartography of stimulation and recording sites in the insula (bottom). n, o. Group mean of AP width (n) and spontaneous firing rate (o) of all the recorded insula neurons (Mann–Whitney test, U = 147.5, p = 0.0006). p Quantification of insula-responsive neurons to the electrical stimulation of the contralateral insula. q Typical PSTH and raster show a contralateral Insula-evoked excitatory response of an Insula neuron. Electrical stimulus at 0 ms, with 5 ms bin width. r Heatmap plot of Z-scored PSTH traces for each individual responsive Insula neuron to an Insula contralateral electrical stimulation. The electrical stimulus is represented by a vertical black line at 0 ms. s Mean Z-score of PSTH over all responsive insula cells. Stim stimulation, Rec recording, PSC postsynaptic current, EPSC excitatory PSC, IPSC inhibitory PSC, AP action potential. Data are presented as mean values ± SEM. *p < 0.05, ***p < 0.001.

