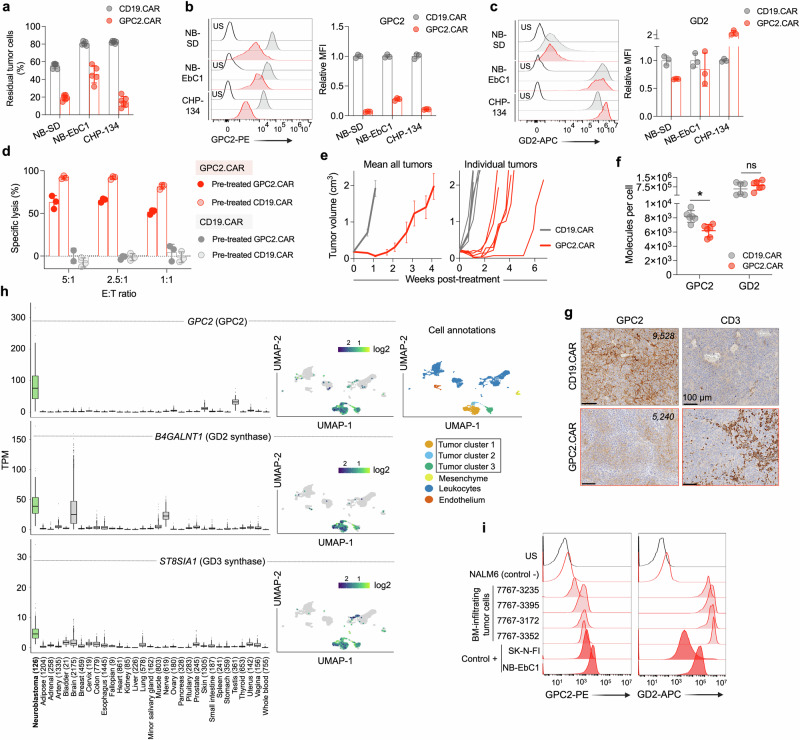
Fig. 1. GPC2.CAR-treated tumor cells downregulate GPC2 but maintain expression of GD2.
a Quantification of residual neuroblastoma cells after GPC2 or CD19 CAR T-cell co-incubation for 4 days [effector:tumor (E:T) ratio of 1:2.5]. Means and SDs are shown (n = 6 technical replicates). b (left) Flow cytometry histograms of GPC2 expression on neuroblastoma cells after GPC2 or CD19 CAR T-cell co-incubation in (a). (right) Fold-change GPC2 cell surface expression on GPC2.CAR vs. CD19.CAR-treated cells. Means and SDs are shown (n = 3 technical replicates). c (left) Flow cytometry histograms of GD2 expression on neuroblastoma cells after GPC2 or CD19 CAR T-cell co-incubation in (a). (right) Fold-change GD2 expression on GPC2.CAR vs. CD19.CAR-treated cells. Means and SDs are shown (n = 3 technical replicates). d CAR T-cell (CD19.CAR or GPC2.CAR) re-exposure assay after 24 hours of co-incubation with CHP-134 cells that were previously exposed to GPC2 or CD19.CAR T cells for 4 days at a 1:2.5 E:T ratio as shown in (a). Means and SDs are shown (n = 3 technical replicates). e (left) Serial tumor volumes of NB-EbC1 xenografts treated with CAR T-cells (CD19.CAR, n = 6 and GPC2.CAR, n = 8). Means and SEM are shown. (right) Individual volumes of tumors used to quantify GPC2 and GD2 expression by flow cytometry in (f). f Quantification of GPC2 and GD2 cell surface molecules from tumors in (e). *P = 0.004 (Mann Whitney t-test; two-tailed). Means and SDs are shown (n = 6). g GPC2 and CD3 immunohistochemistry (IHC) from a representative tumor from both control CD19.CAR and GPC2.CAR-treated mice in (e). Scale bars are indicated. Cell surface molecules determined by flow cytometry of the same tumors are indicated. h (left panels) Plots displaying GPC2, B4GALNT1 and ST8SIA1 expression in high-risk neuroblastoma patient tumors (n = 126) compared to normal tissue RNA sequencing data (n = 16,233 samples across 31 unique normal tissues, n = 9–2175 samples per tissue). N for each tissue is indicated. Box plots extend from first to third-quartile, horizontal line is the median and error bars represent the 1.5 interquartile range from the first-and third-quartile. (right panels) Single-cell RNA-seq plots showing single-cell expression of GPC2, B4GALNT1 and ST8SIA1 (6442 cells35). A UMAP defining the main cell identities is shown. i GPC2 and GD2 flow histograms from bone marrow-infiltrating neuroblastoma cells (n = 4). NALM6 cells were used as a negative control, and NB-EbC1 and SK-N-FI cells were used as positive controls. Gating strategies are shown in Supplementary Fig. 1e. US unstained, MFI mean fluorescence intensity. Represented data has been validated with at least 2 independent experiments. Source data are provided as a Source Data file.

