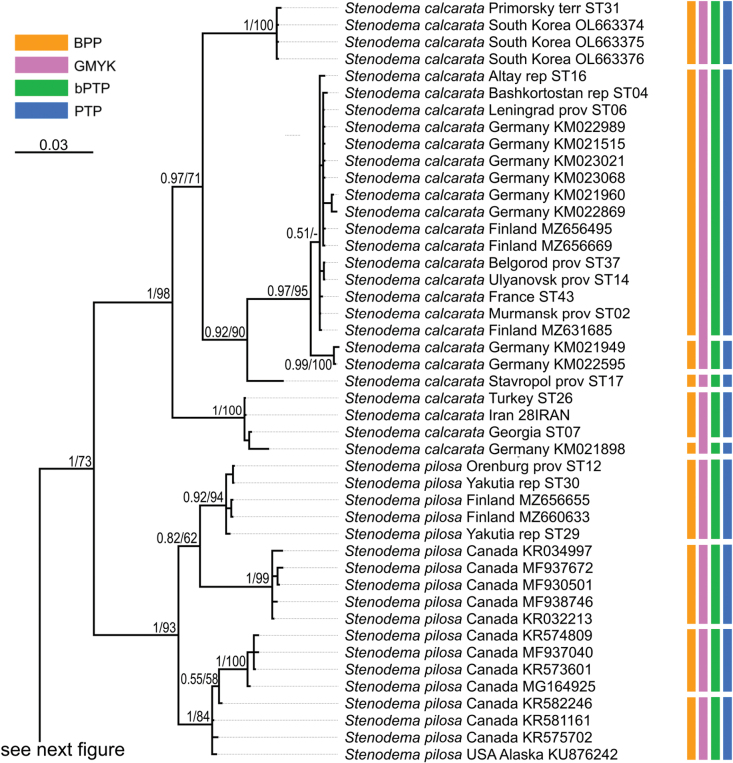
Figure 16.
Phylogeny obtained using the Bayesian inference based on the full dataset dataset, part 1. The supports are provided above the branches. The numbers on the left correspond to PP, the numbers on the right correspond to BS obtained with RAxML. The color stripes correspond to the results of the species delimitation analyses in the following order: BPP, GMYC, bPTP, PTP.

