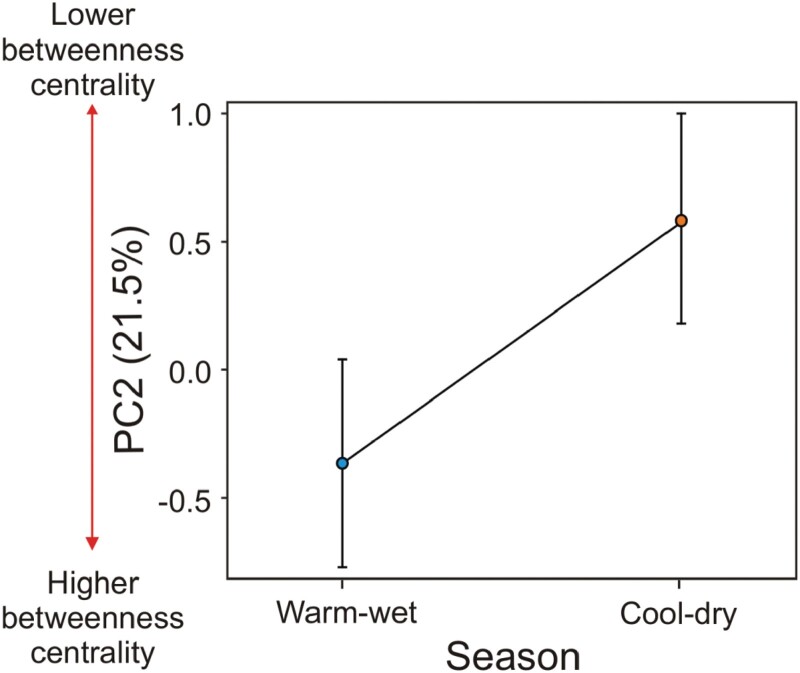
Figure 4.
Mean score values per season of the 2nd axis of the PCA, obtained with 5 individual-based network metrics (see methods for more details). The predictor variable (season) shown was among the fittest models according to the GLMM coupled with model AIC, with statistically significant effects. The number in parenthesis represents the percentage of the total variance explained in the PCA. The vertical bars present the 95% confidence intervals. The red arrow on the left side of y-axis indicates the direction of change of the individuals’ position in the network, according to most related network metric with PC2 (BC).

