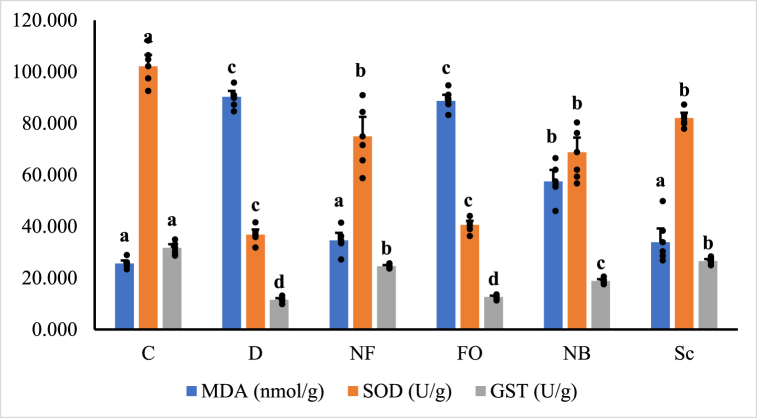
Fig. 8a.
Oxidative stress biomarkers, MDA, SOD and GST in pancreatic tissue homogenate of different groups of male albino rats. Values were expressed as mean ± SE (n = 6) for each group. a,bp < 0.05 significantly different from the diabetic group and b,c,dp < 0.05 significantly different from the control group. Groups with the same superscript letter did not represent any significant differences. MDA (F = 70.777, P < 0.05), SOD (F = 31.354, P < 0.05), GST (F = 99.855, P < 0.05).

