
Figure 3.
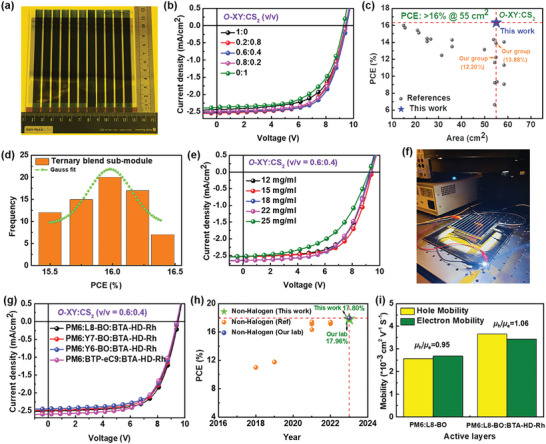
a) Image of sub‐module device. b) J–V curves of the optimized ternary blend (PM6:L8‐BO:BTA‐HD‐Rh) sub‐module with O‐XY:CS2 solvent ratios. c) PCEs of solar sub‐module with areas >20 cm2 (Table S1, Supporting Information). d) Histogram PCEs of ternary blend sub‐modules. e) Best J–V curves of the ternary sub‐module with blend concentrations. f) The image of white LED lighting powered by organic sub‐module. g) Best J–V curves of O‐XY:CS2 processed sub‐modules with different NFAs. h) PCEs of air‐processed small‐area devices using non‐halogen solvents (Table S9, Supporting Information). i) Charge carrier mobilities of optimized binary and ternary devices.