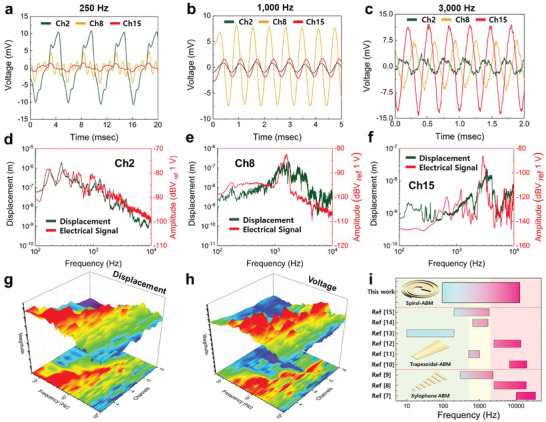
Figure 3.

a–c) The electrical signals measured from channels 2, 8, and 15 when a single frequency signal of 250, 1,000, and 3,000 Hz was applied. d–f) The frequency response characteristics of the displacements and electrical signals measured from channels 2, 8, and 15. g) and h) The displacement and electrical signal measured from the 1 to 16 channels of the S‐ABM sensor. i) A graph comparing the ABM sensors and their frequency ranges in this and previous studies.
