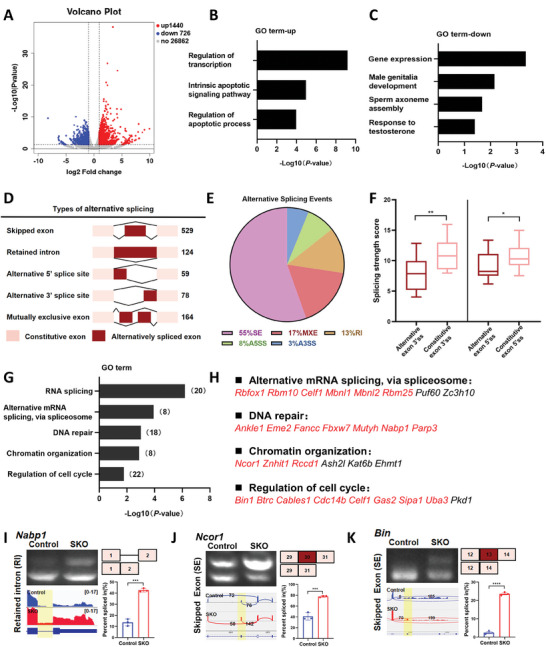
Figure 4.

Ablation of CWF19L2 causes aberrant mRNA splicing in male germ cells. A) Volcano plot of DEGs determined by RNA‐seq analysis of PD6 Cwf19l2‐SKO mice compared to control mice. Blue dots represent significantly downregulated genes, red dots represent significantly upregulated genes, and gray dots represent unchanged genes. B) GO term enrichment analysis of the significantly upregulated genes in the RNA‐seq data. C) GO term enrichment analysis of the significantly downregulated genes in the RNA‐seq data. D) Schematic diagram of five AS types significantly affected by depletion of CWF19L2 in the RNA‐seq data. The numbers of predicted ASEs in each category are indicated. E) Pie chart depicting the proportions of different types of ASEs in the RNA‐seq data. F) Box plots of splice site scores calculated for CWF19L2‐regulated skipped exons. Horizontal line indicates the median and 25% to 75% bounds of the box. *P < 0.05, **P < 0.01 by two‐tailed Student’ s t‐test. G) GO term enrichment analysis of genes with abnormal ASEs in the RNA‐seq. The numbers of representative genes are indicated. H) GO term enrichment analysis of genes with abnormal ASEs in the RNA‐seq. Genes marked in red represent successful verification by RT‐PCR(I‐K) Visualization and validation of abnormal ASEs identified by RNA‐seq in sorted germ cells of Cwf19l2‐SKO and control mice. Gel images showing the RT‐PCR analysis of ASEs of the changed splicing genes in top‐left panel. Tracks from Integrative Genomics Viewer (IGV) for selected candidate genes are shown in the bottom‐left panel, and differentially spliced parts are shaded. Schematics of ASEs are shown in the top‐right panel. Changes in “percent spliced in (△PSI)” are shown in the bottom‐right panel. Data are presented as the mean ± SD, n = 3, ns: not significant, *P < 0.05, **P < 0.01, ***P < 0.001, ****P < 0.0001 by two‐tailed Student’ s t‐test.
