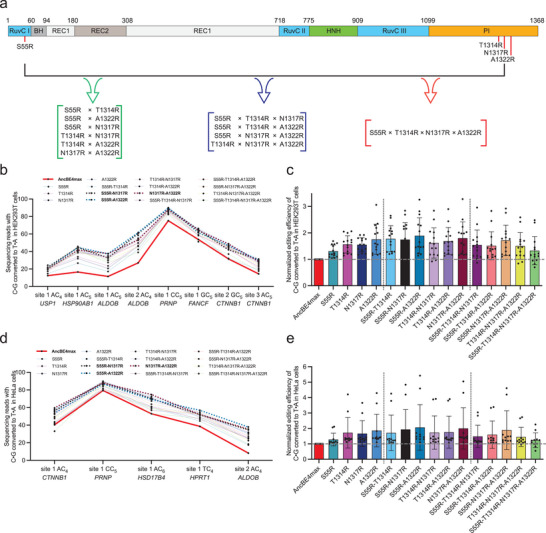
Figure 2.

Combination of X‐to‐R mutations for further improvement of AncBE4max activities. a) The illustration shows the linear domain arrangement of Cas9, with the four enhancing, X‐to‐R substitution sites marked using red solid lines. The brackets in green, deep blue, and red represent double, triple, and quadruple combinatorial mutations, respectively. b) Parallel comparisons were made for AncBE4max, 4 single X‐to‐R variants and 11 combinatorial X‐to‐R variants at eight genomic loci in HEK293T cells. The results show the percentage of C‐to‐T conversion at the mainly edited position within the editing window. The red bold line highlights AncBE4max as the benchmark, and the three bold dashed lines mark the top‐performer double X‐to‐R variants. Data are presented as means ± s.d. (n = 3 biological replications). c) Results in (b) were further analyzed by considering editing efficiency at all sites (means ± s.d., n = 8 sites) as a whole. The editing levels induced by the control AncBE4max at each site were set as 1 (position marked by a horizontal gray dashed line). d) The experiment similar to (b) was carried out in HeLa cells at five endogenous genomic loci. The results show the percentage of C‐to‐T conversion at the mainly edited position within the editing window. The red bold line highlights AncBE4max as the benchmark, and the three bold dashed lines mark the top‐performer double X‐to‐R variants. Data are means ± s.d. (n = 3 biological replications). e) Results in (d) were further analyzed by considering editing efficiency at all sites (means ± s.d., n = 5 sites) as a whole. The editing levels induced by the control AncBE4max at each site were set as 1 (position marked by a horizontal gray dashed line).
