
Figure 4.
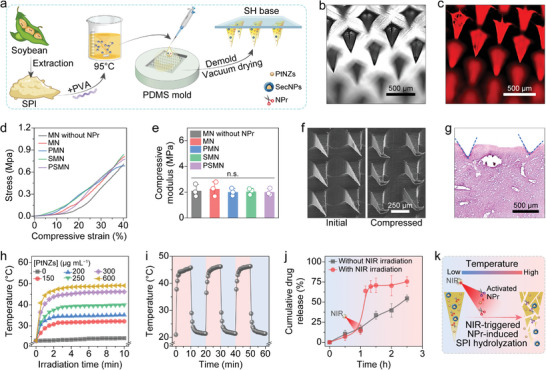
Fabrication and characterization of MN arrays. a) Schematic diagram of fabricating MN arrays with SH substrates and SPI‐PVA needle tips loaded with SecNPs, PtNZs, or NPr. b,c) Representative images of MNs in bright (b) and fluorescent (c) fields. d,e) Mechanical strength of various MNs evaluated by compressive stress‐strain curves (d) and corresponding quantified compressive moduli (e). f) Representative SEM images of MNs prior to and following the compression test. g) Representative histopathological image of H&E‐stained liver tissue post MN insertion. h) Photothermal effect of PMN arrays containing different concentrations of PtNZs under NIR irradition. i) Temperature variations of PMN arrays over three NIR irradiation on/off cycles. j) Cumulative release profiles of PSMN arrays with or without the irradiation of NIR. k) Schematic illustration of NIR‐triggered NPr activation and SPI hydrolyzation by the activated NPr. Data are presented as mean ± SD (n = 3). Statistical significances were assessed by one‐way ANOVA with Tukey's multiple comparisons post hoc test. n.s., not significant.