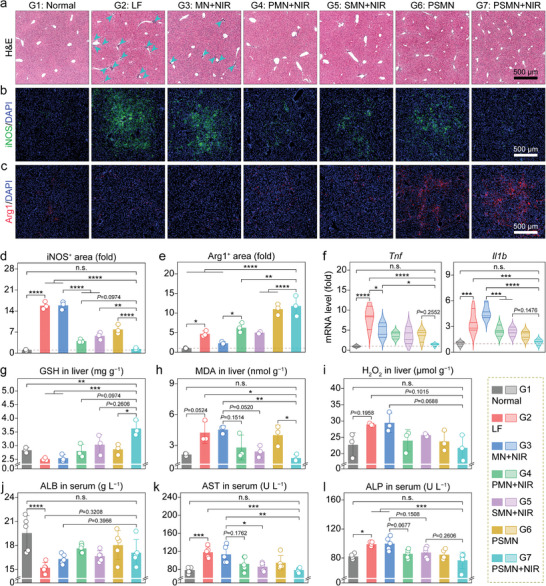
Figure 6.

Anti‐inflammatory and hepatoprotective effects of MN arrays in the liver‐fibrotic murine model. a–c) Representative images for H&E staining (arrows indicate immune cell infiltration) (a), iNOS immunofluorescence (b), and Arg1 immunofluorescence (c) of liver tissue sections from mice following the indicated treatments. d,e) Relative quantifications of iNOS+ area (d), and Arg1+ area (e) conducted based on the corresponding micrographs. f) Relative intrahepatic mRNA levels of proinflammatory factors (Tnf and Il1b). g–i) Intrahepatic levels of factors involved in redox homeostasis and oxidative stress, encompass GSH (g), MDA (h), and H2O2 (i). j–l) Serum levels of factors associated with liver function and dysfunction, including ALB (j), AST (k), and ALP (l). Data are presented as mean ± SD (n = 3, panels d, e, and g–i; n = 4, panel f; n = 5, panels j–l). Statistical significances were estimated employing one‐way ANOVA with Tukey's multiple comparisons post hoc test. * p < 0.05; ** p < 0.01; *** p < 0.001; **** p < 0.0001; and n.s., not significant.
