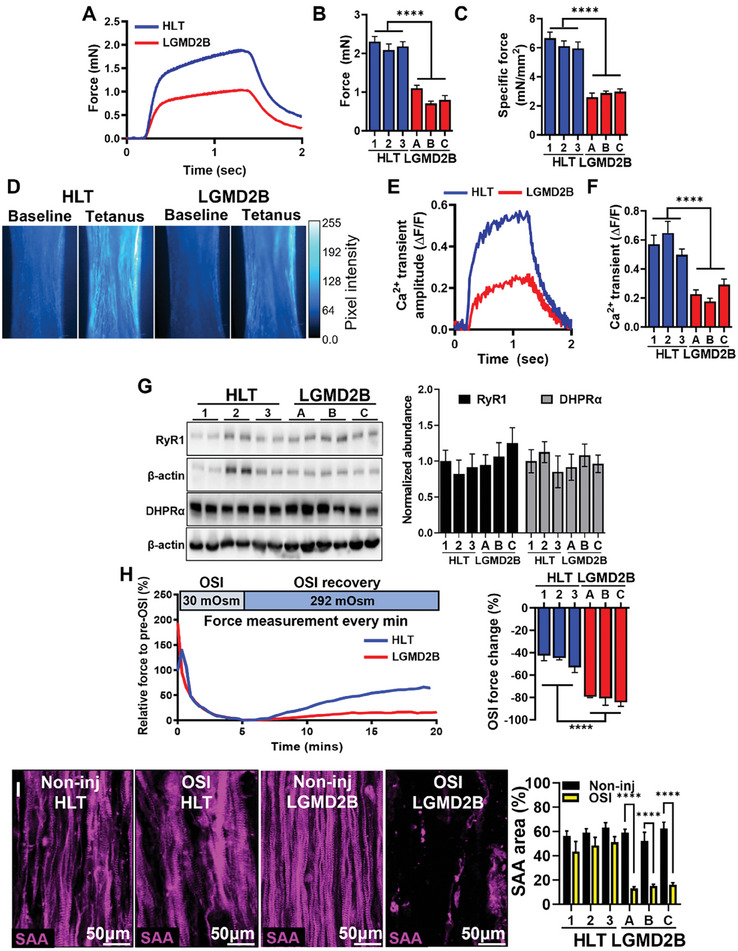
Figure 2.

Functional characterization of healthy and LGMD2B myobundles. A) Representative tetanic force traces and quantifications of B) force (n = 16‐18 per donor) and C) specific force (n = 6 per donor) generation in healthy (HLT) and LGMD2B myobundles. D–F) Representative D) Fluo‐8 AM fluorescence intensity images at baseline and peak tetanic contraction, E) corresponding Ca2+ transient traces, and F) quantified Ca2+ transient amplitudes (ΔF/F of Fluo‐8, n = 6–8 per donor). G) Representative western blots and quantified protein abundance (normalized to β‐actin) of ryanodine receptor 1 (RyR1) and dihydropyridine receptor α (DHPRα), (N = 4 differentiations per donor, 6 pooled myobundles per differentiation) H) Representative traces and quantification of force change before and after osmotic shock injury (OSI, n = 6 myobundles per donor). I) Representative immunostaining of SAA pre‐ and post‐OSI and corresponding quantification of percent SAA+ area. **** P < 0.0001 in LGMDB vs. HLT or non‐injured vs. OSI (in I).
