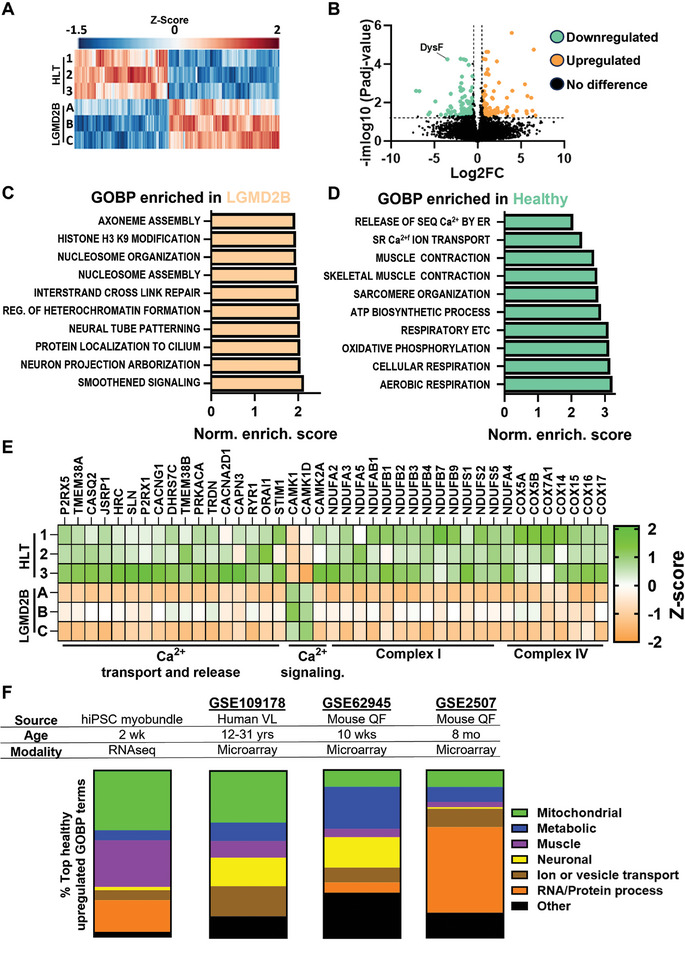
Figure 3.

Transcriptomic comparisons of healthy and LGMD2B myobundles and native muscle. A,B) RNA‐seq (A) heatmap and (B) volcano plot of genes with significantly different (Padj < 0.05, |log2FC| ≥ 1) expression in LGMD2B vs. healthy myobundles. C,D) GOBP terms (identified by GSEA on RNA‐seq data) enriched in (C) healthy and (D) LGMD2B myobundles against normalized enrichment score (FDR < 0.15). E) Expression heatmaps of selected genes related to calcium handling and mitochondrial biological processes in LGMD2B vs. HLT myobundles. F) Comparison of GOBP terms upregulated in RNA‐seq analysis from healthy vs. LGMD2B myobundles and microarray datasets from native symptomatic human and presymptomatic (10 wks) and symptomatic (8 mo) mouse healthy vs. LGMD2B muscles.
