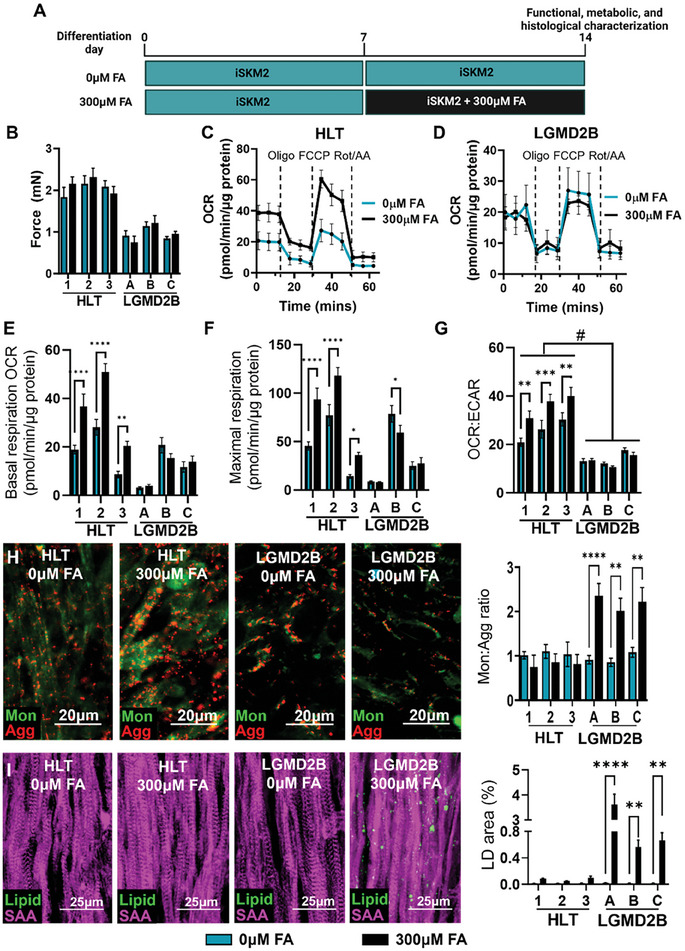
Figure 4.

Mitochondrial dysfunction and lipid accumulation in LGMD2B myobundles. A) Schematic of experimental flow to assess effects of fatty acid (FA) supplementation on myobundles. B) Tetanic force generation following 0 and 300 µm FA (n = 4 myobundles per group). C–G) Representative Seahorse XFe24 analyzer oxygen consumption rate (OCR) traces in (C) healthy (HLT) and (D) LGMD2B myobundles and quantification of E) basal respiration, F) maximal respiration, and G) OCR:ECAR (n = 8–10 myobundles per group). H) Representative images of JC‐10 staining in healthy and LGMD2B myobundles cultured in 0 or 300 µm FA and corresponding quantification of the ratio of green monomer (mon) to red aggregate (agg) area (n = 12 per group). I) Representative immunostaining of LipidSpot (Lipid) and SAA and quantification of lipid droplet (LD) area (n = 12 per group). * P < 0.05, ** P < 0.01, *** P < 0.001, **** P < 0.0001 vs. 0 µm FA. Data: mean ± SEM.
