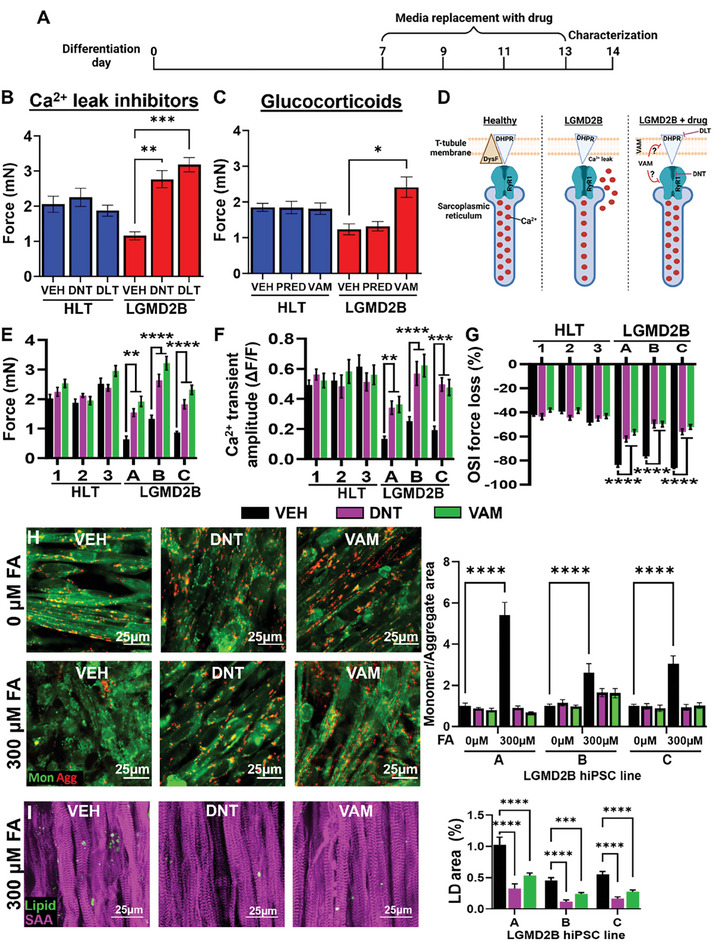
Figure 5.

Roles of Ca2+ overload in LGMD2B myobundle dysfunction. A) Schematic of drug testing timeline. B,C) Quantification of force generation in healthy (HLT) and LGMD2B myobundles treated with vehicle (VEH) or B) L‐type Ca2+ channel inhibitor 1 µm diltiazem (DLT) or RyR inhibitor 1 µm dantrolene (DNT), or C) glucocorticoids 1 µm prednisone (PRED) or 1 µm vamorolone (VAM). D) Schematic showing expected effects of drug therapy on Ca2+ overload in LGMD2B muscle. E–G) Quantification of E) force generation, F) Ca2+ transient amplitudes (ΔF/F of Fluo‐8), and G) OSI force changes in HLT and LGMD2B myobundles treated with 1 µm DNT and 1 µm VAM (n = 4‐8 per group). H) Representative images of JC‐10 staining in LGMD2B myobundles and corresponding quantification of the ratio of green monomer (mon) to red aggregate (agg) area (n = 12 per group). I) Representative staining of LipidSpot (Lipid) and SAA and quantification of lipid droplet (LD) area (n = 12 per group). * P < 0.05, ** P < 0.01, *** P < 0.001, **** P < 0.0001 vs. VEH. Data: mean ± SEM.
