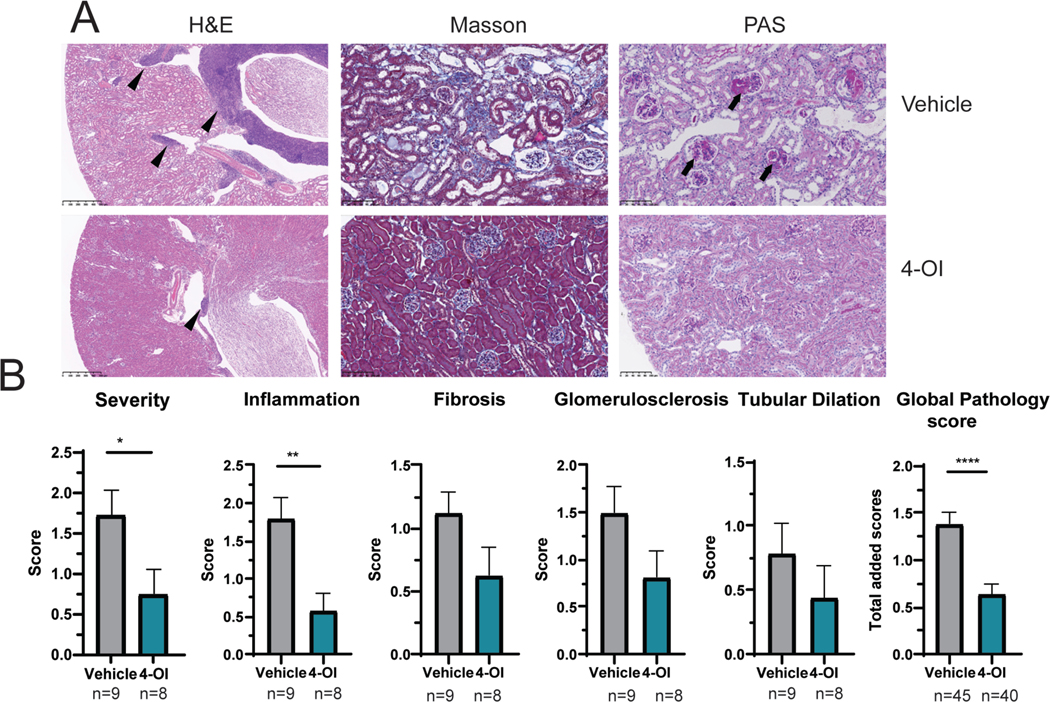
Figure 1: Attenuation of lupus kidney pathology by 4-OI.

A) Representative kidney tissue images showing H&E, Masson, and PAS staining. Magnifications are 40x for H&E and 200x for Masson and PAS. In H&E; arrowheads show inflammation. In PAS, arrows indicate glomerulosclerosis. B) Graphs display kidney pathology scores. Bar graphs represent mean ± SEM. In all studies mice were treated with 4-OI or vehicle control; n=number of animals except in global pathology score where all the individual scores (severity, inflammation, fibrosis, glomerulosclerosis, and tubular dilation) are graphed together per group. The statistical analysis was done using Mann Whitney test *:p<0.05, **:p<0.01: ****:p<0.001.
