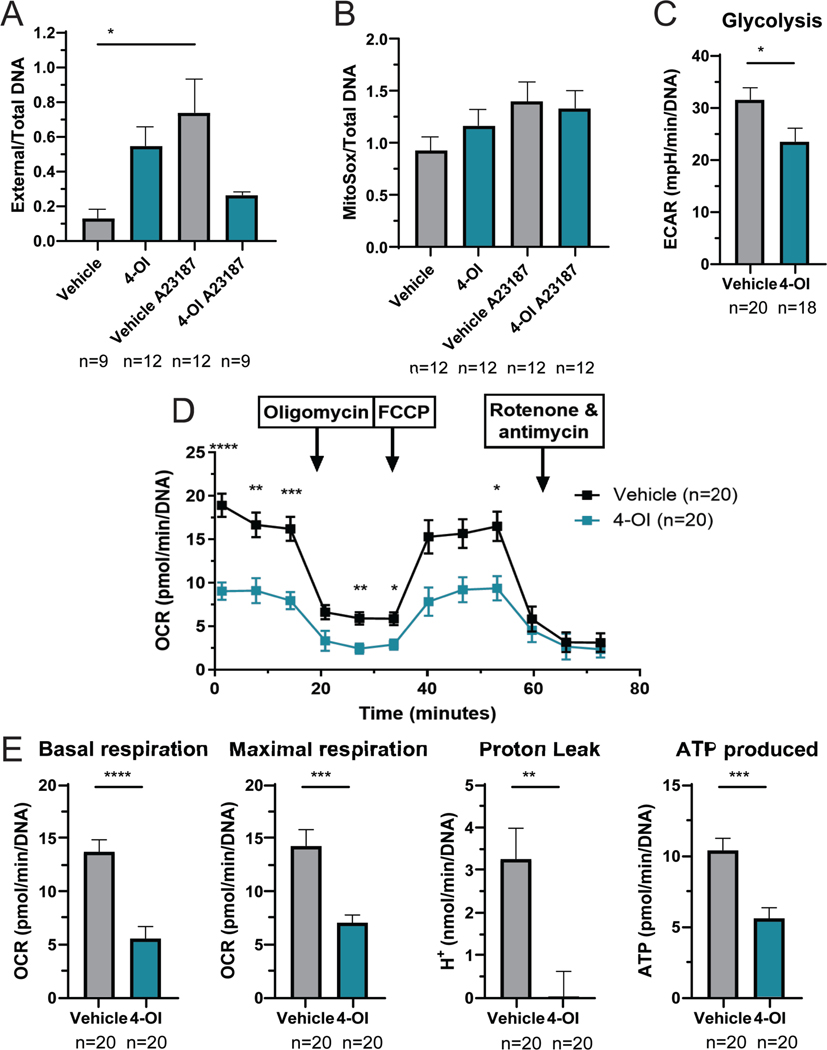
Figure 5: 4-OI modulates NET formation and immune-metabolism.
A) NETs were quantified in BM-derived neutrophils, 2 h post-plating, by SYTOX/Pico Green plate assay to measure external and total DNA, respectively. B) mROS was quantified in BM-derived neutrophils at 1 h using MitoSox, by plate assay. In both A and B, mice were treated with 4-OI or vehicle control per group; data points include 4 animals per group and 3 technical repeats, and neutrophils were stimulated with the A23187 calcium ionophore (250 uM) to induce NETs and mROS. The statistical analysis was done using Mann Whitney test *:p<0.05. C) Glycolysis of murine BM-differentiated macrophages, measured by Seahorse; data points are shown which include 4 animals per group and 5 technical repeats. D) Seahorse mitochondrial stress test analysis of splenocytes; statistical analysis using 2-way ANOVA. E) Parameters for splenocytes calculated from D. Seahorse studies included mice treated with 4-OI or vehicle control per group; data points shown include 4 animals per group and 5 technical repeats. Bar graphs represent mean ± SEM. The statistical analysis was done using Mann Whitney test, **:p<0.01; ***:p<0.005; ****p<0.001. In these experiments outlier data points excluded were detected using GraphPad ROUT method (Q=10%).

