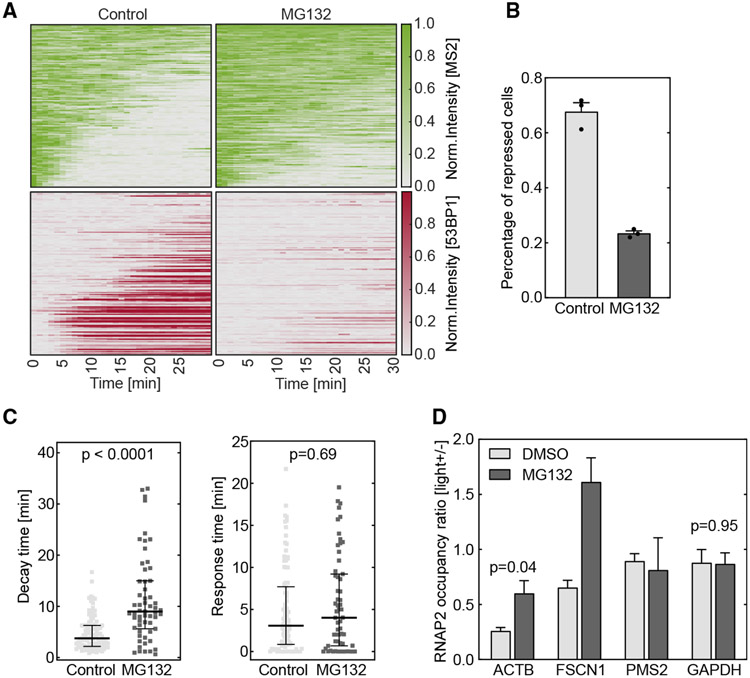
Figure 4. DSB-induced transcription repression is regulated by proteasome-mediated RNAPII removal.
Cells were treated with 20 μM MG132 for 1 h to inhibit proteasome. The DSB was induced by vfCRISPR in a live-cell transcription reporter (Figure 1A) stably integrated in U-2 OS cells (A–C) or endogenous ACTB in HEK293T cells (D).
(A) Heatmaps of TS and 53BP1 intensities were measured from live-cell imaging as in Figure 1 (MG132, n = 119 cells; negative control, n = 110 cells). All stimulated cells were analyzed since there was no 53BP1 recruitment.
(B) Percentages of repressed cells were measured for drug treatment and control samples during 30 min tracking. Cells were considered repressed if the averaged TS intensities in the last 4 frames were lower than a threshold determined from control cells with 53BP1 recruitment. Error bar: SEM (n = 3 biological replicates).
(C) Transcription decay and response times were obtained by fitting the delayed decay model (Figure 1G) to the repressed TS intensities in (B) (MG132, n = 59 cells; negative control, n = 94 cells). Error bar: quartiles. An unpaired Mann-Whitney test was performed.
(D) ChIP-qPCR experiments of RNAPII were performed in HEK293T cells when the ACTB locus was damaged by vfCRISPR. Change of RNAPII occupancy (measured in RPM) upon light stimulation on the ACTB locus and nearby genes were measured in MG132-treated and control samples. GAPDH on a different chromosome served as a control gene to indicate global transcriptome change upon UV exposure. FSCN1: 70 kb from DSB. PMS2: 487 kb from DSB. Error bar: SEM (n = 2 biological replicates). Unpaired t test was performed.

