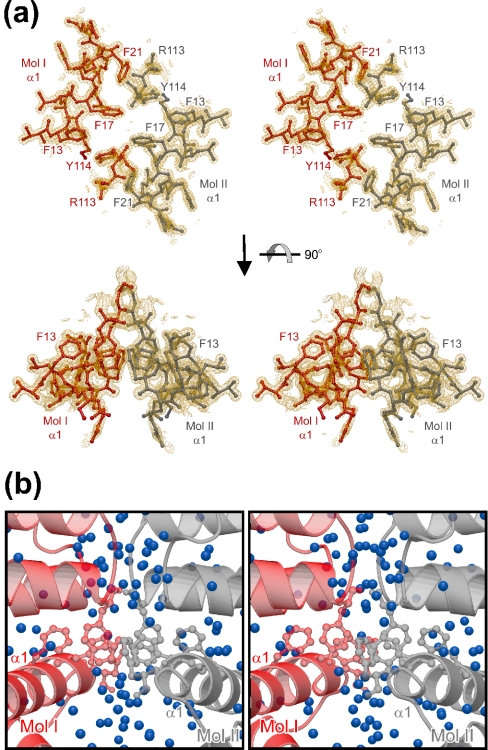
Figure 3. tmaNusB dimerization in the crystal.
(a) Stereo plot of the aromatic interactions in the dimer interface of crystal form 4. The orientation of the upper panel is that of Figure 1(a) rotated 90° into the plane of the paper around the vertical axis. Residues originating from one monomer are in red, and those from the other monomer are in grey. The aromatic residues participating in the interaction network are labelled. Arg113 may support the arrangement by additional cation–π interactions. A 2Fo–Fc electron density map for the final model contoured at the 2σ level is superimposed. (b) Close-up view of the dimer interface in default orientation. Molecules are coloured as in (a). Blue spheres denote water molecules in the structure, mediating a large number of indirect interactions between the monomers. The side chains of the critical aromatic amino acids are drawn in ball-and-stick notation.

