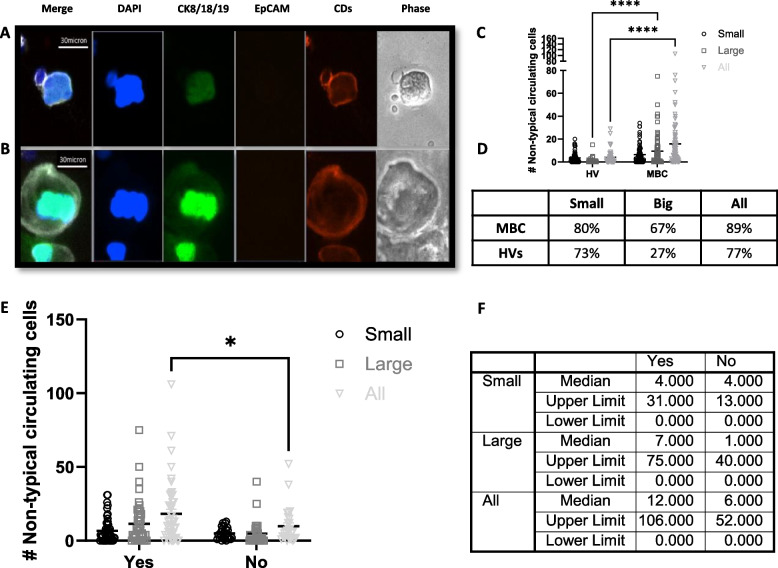
Fig. 5.
Non-typical circulating cells. A Representative image of a small non-typical circulating cell. B Representative image of a large non-typical circulating cell. Images were taken using a BioView Allegro Plus imaging system with a 10 × objective lens (CKs-AF488 in green, EpCAM-AF555 in orange, Blood lineage markers-APC in red/white in the merge image, nucleus-DAPI in blue). C Dot plot showing mean ± SEM of the number of non-typical circulating cells in each category in the harvest of 72 HV donors and 75 MBC (Two-Way ANOVA followed by Sidak’s multiple comparison test, ****P ≤ 0.0001). D Table shows the percentage donors with ≥ 1 non-typical blood cell. E Dot plot showing mean ± SEM of the number of non-typical circulating cells of each type in the harvest of 75 MBC (Two-Way ANOVA followed by Sidak’s multiple comparison test, *P ≤ 0.05) divided in patients receiving or not cytotoxic therapy. F Table shows median and range numbers of graph E

