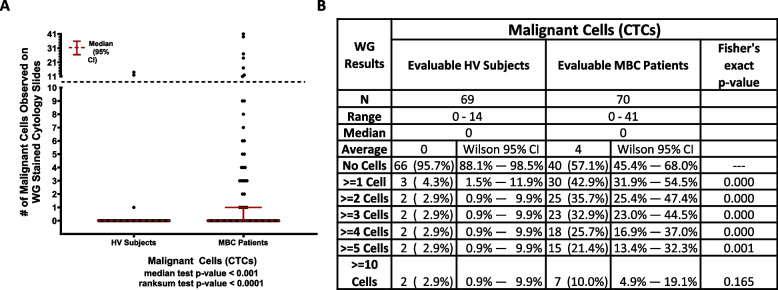
Fig. 6.
WG evaluation results. A Dot plot shows median ± 95% CI of the number of malignant cells (CTCs) identified in each MBC and HV donor by WG. A statistically higher number of CTCs were found in MBC patients compared to HVs (p ≥ 0.001, Median test). B Table shows number of donors included in each cohort (N), range, median and average number of CTCs identified within each cohort, and, using CTC thresholds of 0, ≥ 1, ≥ 2, ≥ 3, ≥ 4, ≥ 5 and ≥ 10 CTCs identified, the number and percentage of donors within each CTC category along with Wilson 95% CI’s for each proportion. The Fisher’s exact test p-values shown are for the comparison of the proportions of HV subjects and MBC patients with less than vs. greater than or equal to varying numbers of CTCs observed on the WG-slides, and in each instance up to ≥ 5 CTCs, a significantly higher proportion of MBC patients were CTCs positive compared to the HV subjects

