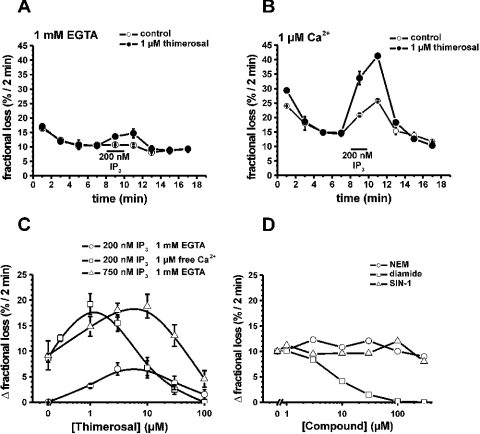
Figure 4. Effect of thimerosal on IICR in the presence or absence of 1 μM free Ca2+ in permeabilized A7r5 cells.
Data are plotted as fractional loss (the amount of 45Ca2+ leaving the stores in 2 min divided by the total store Ca2+ content at that time) as a function of time in (A, B). (A) Effect of the presence (•) or absence (○) of 1 μM thimerosal on Ca2+ release provoked by 200 nM IP3 in the absence of Ca2+. (B) Effect of the presence (•) or absence (○) of 1 μM thimerosal on Ca2+ release provoked by 200 nM IP3 in the presence of 1 μM free Ca2+. (C) Bell-shaped dependence of the effect of thimerosal on IICR. Data are plotted as the difference between the fractional loss after the addition of IP3 and the fractional loss before the addition of IP3 as a function of the thimerosal concentration: ○, 200 nM IP3, 1 mM EGTA; □, 200 nM IP3, 1 μM free Ca2+; Δ, 750 nM IP3, 1 mM EGTA. (D) Effect of NEM (○), diamide (□) and SIN-1 (Δ) on IICR. Data are plotted as the difference between the fractional loss after the addition of IP3 and the fractional loss before the addition of IP3 as a function of the NEM, diamide or SIN-1 concentration respectively. The experiment was performed using 750 nM IP3 and in the presence of 1 mM EGTA. Each curve represents the means±S.E.M for three wells.

