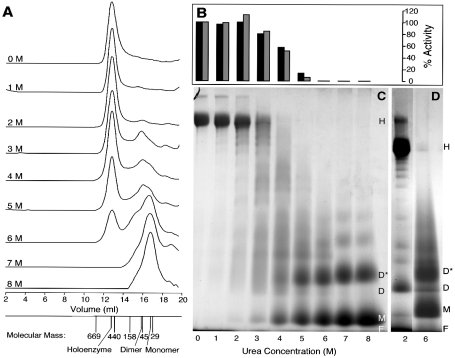
Figure 2. Gel permeation chromatography, enzyme activity and BN gels of recombinant soluble SOR dialysed against various concentrations of urea as described in the Experimental section.
(A) Merged gel permeation chromatograms given with the respective urea concentration. The protein peaks were monitored by measuring the A280. The elution volumes of thyroglobulin, ferritin, aldolase, chicken albumin and carbonic anhydrase are given with their molecular masses, together with the holoenzyme, dimer and monomer peaks. (B) Relative specific activities of the SOR fractions after dialysis against different urea concentrations as indicated below the gel (C). The oxygenase (black) and reductase activities (grey) of the 0 M urea control were each set to 100%. (C) BN gradient gel of SOR preparations dialysed against different urea concentrations re-stained with colloidal Coomassie Blue after electrophoresis. (D) As in (C) showing a ladder of oligomers of the partially denatured enzyme. H, holoenzyme; D*, dimer denatured; D, dimer; M, monomer; F, migration front.

