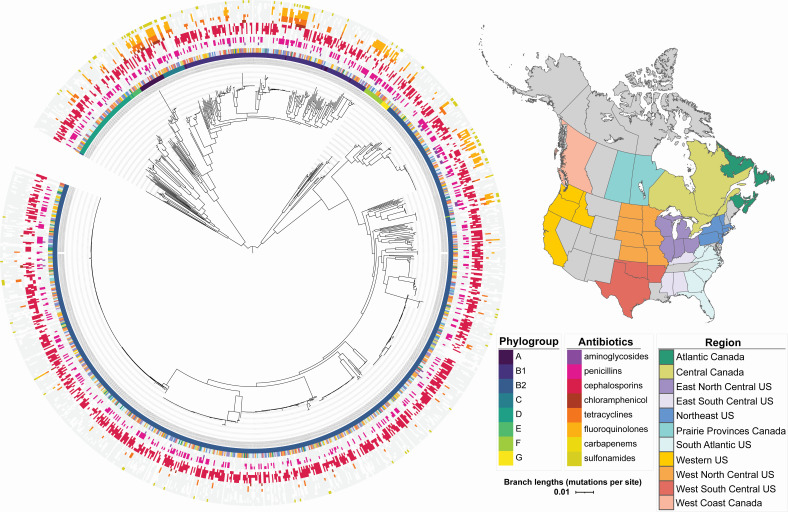
Fig 2.
Core genome phylogeny of E. coli sampled from dog hosts across US and Canadian regions participating in the surveillance program, with geographic regions, phylogroups, and antibiotic resistance phenotypes annotated on that phylogeny. The map was created using the ne_states function within the rnaturalearth R package, the geom_sf function within the sf R package, and ggplot2.

