. 2024 Jun 28;18(3):133–145. doi: 10.2478/abm-2024-0019

Figure 1.

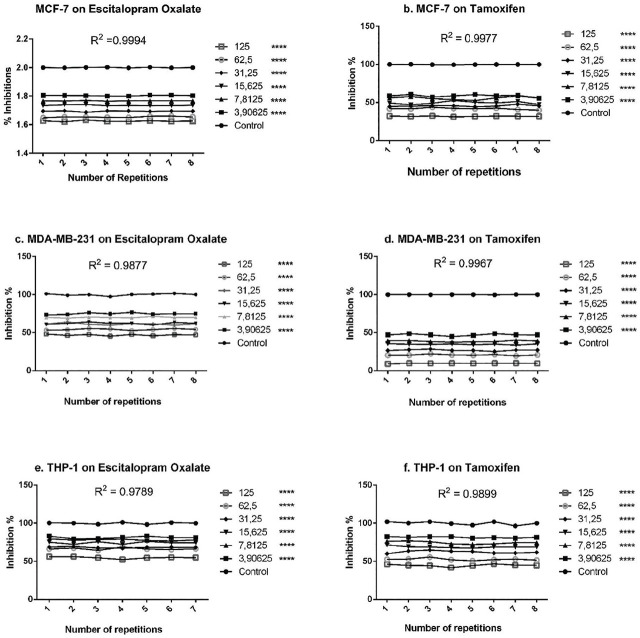
Graphs showing inhibition percentages for different cell lines (MCF-7, MDA-MB-231, and THP-1) treated with Escitalopram Oxalate or Tamoxifen over multiple repetitions. The figure consists of six line graphs showing the inhibition percentage for three cell lines—MCF-7, MDA-MB-231, and THP-1—treated with Escitalopram Oxalate or Tamoxifen across various concentrations and repetitions. Each graph contains a curve representing different concentrations (125, 62.5, 31.25, 15.625, 7.8125, and 3.90625) with a control for comparison. Key details are: 1. **Graph a (MCF-7 on Escitalopram Oxalate)**: R² = 0.9994 shows inhibition % over repetitions. 2. **Graph b (MCF-7 on Tamoxifen)**: R² = 0.9977 with similar inhibition % representation. 3. **Graph c (MDA-MB-231 on Escitalopram Oxalate)**: R² = 0.9877 tracks inhibition % over repetitions. 4. **Graph d (MDA-MB-231 on Tamoxifen)**: R² = 0.9967 shows the effect over repetitions. 5. **Graph e (THP-1 on Escitalopram Oxalate)**: R² = 0.9789 with inhibition % data over repetitions. 6. **Graph f (THP-1 on Tamoxifen)**: R² = 0.9899 shows inhibition % change across repetitions. Each graph shows a significant difference between different concentrations (denoted by **** for all values), indicating statistical significance.

Cell viability values and statistical evaluation of escitalopram oxalate and tamoxifen (positive control) concentrations on MCF-7, MDA-MB-231, and THP-1 cell lines (****P < 0.0001, R2 is coefficient of determination).