. 2024 Jun 28;18(3):133–145. doi: 10.2478/abm-2024-0019

Figure 2.

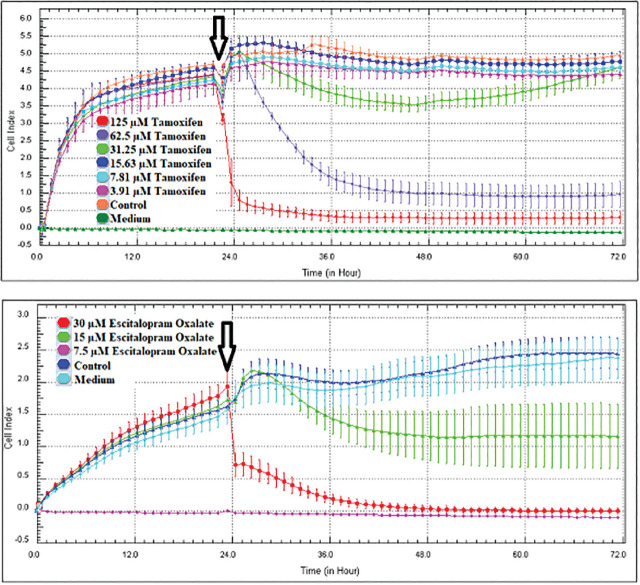
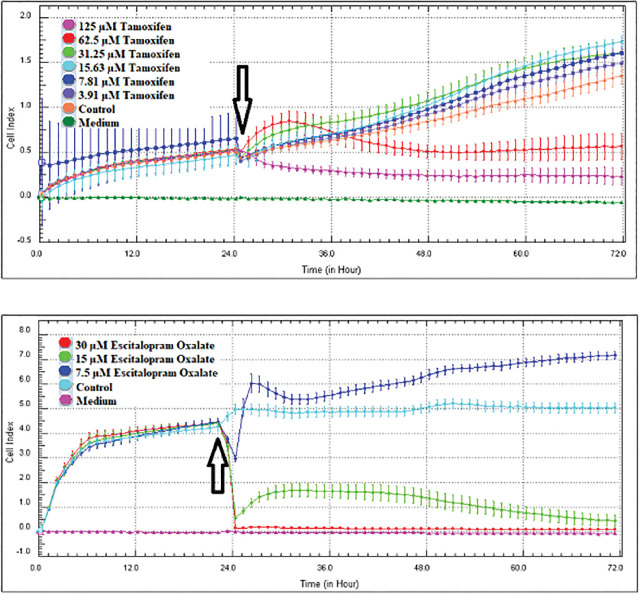
Two line graphs showing cell index over time for different concentrations of Tamoxifen (top graph) and Escitalopram Oxalate (bottom graph), with control and medium comparisons. Two line graphs showing cell index over time for different concentrations of Tamoxifen (top graph) and Escitalopram Oxalate (bottom graph), with control and medium comparisons, marked with a significant drop around 24 hours. The image contains two line graphs comparing the effect of Tamoxifen (top graph) and Escitalopram Oxalate (bottom graph) on cell index over time. **Top Graph (Tamoxifen)**: - The Y-axis represents the cell index, ranging from -0.5 to 5.5. - The X-axis shows time in hours, ranging from 0 to 72. - The graph includes curves for different concentrations of Tamoxifen: 125, 62.5, 31.25, 15.63, 7.91, and 3.91 µM. - Control and medium conditions are also shown. - A marked drop in cell index occurs at approximately 24 hours (indicated by a black arrow), followed by a slow recovery for lower concentrations, while higher concentrations show a sustained decline in cell index. **Bottom Graph (Escitalopram Oxalate)**: - The Y-axis represents the cell index, ranging from 0 to 3. - The X-axis shows time in hours, ranging from 0 to 72. - The graph includes curves for different concentrations of Escitalopram Oxalate: 30, 15, and 7.5 µM. - Control and medium conditions are also plotted. - Similar to the top graph, there is a marked drop in cell index around 24 hours (indicated by a black arrow), with subsequent recovery for lower concentrations and continued inhibition for higher doses. Both graphs illustrate how increasing concentrations of Tamoxifen and Escitalopram Oxalate significantly reduce cell index after a certain point in time. The image contains two line graphs comparing the effect of Tamoxifen (top graph) and Escitalopram Oxalate (bottom graph) on cell index over time, with control and medium conditions included for comparison. **Top Graph (Tamoxifen)**: - The Y-axis represents the cell index, ranging from -0.5 to 2.0. - The X-axis shows time in hours, ranging from 0 to 72. - Different concentrations of Tamoxifen are shown: 125, 62.5, 31.25, 15.63, 7.81, and 3.91 µM, as well as control and medium. - Around 24 hours (marked by a black arrow), a significant drop in cell index occurs for all concentrations, followed by varying degrees of recovery depending on the dose, with higher concentrations leading to continued inhibition and lower concentrations allowing recovery. **Bottom Graph (Escitalopram Oxalate)**: - The Y-axis represents the cell index, ranging from 0 to 8. - The X-axis also represents time in hours, ranging from 0 to 72. - Concentrations of Escitalopram Oxalate tested are 30, 15, and 7.5 µM, along with control and medium. - Similar to the top graph, a significant drop in cell index is observed around 24 hours (marked by a black arrow), followed by a varied response in recovery based on the concentration. Higher doses (30 µM) show sustained inhibition, while lower doses exhibit a gradual recovery. Both graphs emphasize the cytotoxic effects of Tamoxifen and Escitalopram Oxalate over time, particularly after the 24-hour mark, with concentration-dependent inhibition.

Two line graphs showing cell index over time for different concentrations of Tamoxifen (top graph) and Escitalopram Oxalate (bottom graph), with control and medium comparisons. Two line graphs showing cell index over time for different concentrations of Tamoxifen (top graph) and Escitalopram Oxalate (bottom graph), with control and medium comparisons, marked with a significant drop around 24 hours. The image contains two line graphs comparing the effect of Tamoxifen (top graph) and Escitalopram Oxalate (bottom graph) on cell index over time. **Top Graph (Tamoxifen)**: - The Y-axis represents the cell index, ranging from -0.5 to 5.5. - The X-axis shows time in hours, ranging from 0 to 72. - The graph includes curves for different concentrations of Tamoxifen: 125, 62.5, 31.25, 15.63, 7.91, and 3.91 µM. - Control and medium conditions are also shown. - A marked drop in cell index occurs at approximately 24 hours (indicated by a black arrow), followed by a slow recovery for lower concentrations, while higher concentrations show a sustained decline in cell index. **Bottom Graph (Escitalopram Oxalate)**: - The Y-axis represents the cell index, ranging from 0 to 3. - The X-axis shows time in hours, ranging from 0 to 72. - The graph includes curves for different concentrations of Escitalopram Oxalate: 30, 15, and 7.5 µM. - Control and medium conditions are also plotted. - Similar to the top graph, there is a marked drop in cell index around 24 hours (indicated by a black arrow), with subsequent recovery for lower concentrations and continued inhibition for higher doses. Both graphs illustrate how increasing concentrations of Tamoxifen and Escitalopram Oxalate significantly reduce cell index after a certain point in time. The image contains two line graphs comparing the effect of Tamoxifen (top graph) and Escitalopram Oxalate (bottom graph) on cell index over time, with control and medium conditions included for comparison. **Top Graph (Tamoxifen)**: - The Y-axis represents the cell index, ranging from -0.5 to 2.0. - The X-axis shows time in hours, ranging from 0 to 72. - Different concentrations of Tamoxifen are shown: 125, 62.5, 31.25, 15.63, 7.81, and 3.91 µM, as well as control and medium. - Around 24 hours (marked by a black arrow), a significant drop in cell index occurs for all concentrations, followed by varying degrees of recovery depending on the dose, with higher concentrations leading to continued inhibition and lower concentrations allowing recovery. **Bottom Graph (Escitalopram Oxalate)**: - The Y-axis represents the cell index, ranging from 0 to 8. - The X-axis also represents time in hours, ranging from 0 to 72. - Concentrations of Escitalopram Oxalate tested are 30, 15, and 7.5 µM, along with control and medium. - Similar to the top graph, a significant drop in cell index is observed around 24 hours (marked by a black arrow), followed by a varied response in recovery based on the concentration. Higher doses (30 µM) show sustained inhibition, while lower doses exhibit a gradual recovery. Both graphs emphasize the cytotoxic effects of Tamoxifen and Escitalopram Oxalate over time, particularly after the 24-hour mark, with concentration-dependent inhibition.

MCF-7 and MDA-MB-231 cell lines proliferation curve of 48 h concentrations of tamoxifen and escitalopram oxalate (n = 4, mean ± standard deviation). After 24 h, tamoxifen/escitalopram oxalate was given (arrowed). When the device starts to read again, the cell proliferation according to the concentrations is displayed on the graph hourly.