. 2024 Jun 28;18(3):133–145. doi: 10.2478/abm-2024-0019

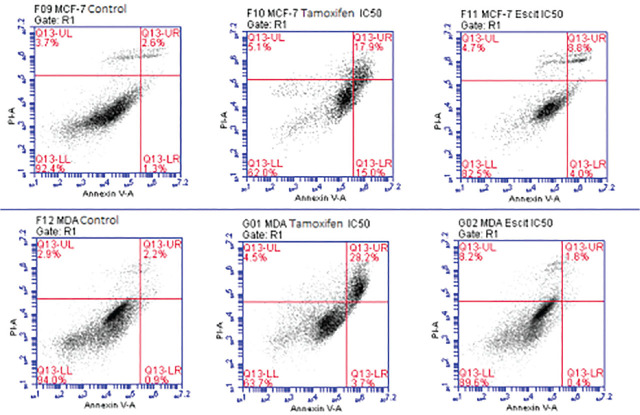
Figure 3.

Scatter plots showing flow cytometry results for MCF-7 and MDA cells treated with Tamoxifen and Escitalopram Oxalate at IC50 concentrations, along with control plots. The image consists of six scatter plots representing flow cytometry results, analyzing apoptosis in MCF-7 and MDA-MB-231 cells treated with Tamoxifen and Escitalopram Oxalate at their IC50 concentrations, compared to controls. **Top Row (MCF-7 cells)**: 1. **F09 MCF-7 Control**: - Majority of cells (92.4%) are in the lower-left quadrant (Q13-LL), indicating live cells. - Minimal apoptosis is seen in the upper-right quadrant (Q13-UR, 2.6%). 2. **F10 MCF-7 Tamoxifen IC50**: - Apoptosis increases significantly (Q13-UR, 17.9%). - Live cells decrease to 62.0% (Q13-LL). 3. **F11 MCF-7 Escitalopram Oxalate IC50**: - Apoptosis in the upper-right quadrant is 3.8%. - Live cells remain the majority (Q13-LL, 81.0%). **Bottom Row (MDA-MB-231 cells)**: 1. **F12 MDA Control**: - Most cells (84.9%) are live (Q13-LL), with minimal apoptosis (Q13-UR, 2.2%). 2. **G01 MDA Tamoxifen IC50**: - Apoptosis increases to 28.7% in the upper-right quadrant. - Live cells drop to 62.7% (Q13-LL). 3. **G02 MDA Escitalopram Oxalate IC50**: - Apoptosis is relatively low (Q13-UR, 1.6%). - Majority of cells remain live (Q13-LL, 81.4%). These scatter plots display how Tamoxifen induces significant apoptosis in both MCF-7 and MDA-MB-231 cells, while Escitalopram Oxalate shows comparatively less apoptosis.

The effect of IC50 values of tamoxifen and escitalopram oxalate on MCF-7 and MDA-MB-231 cell lines by staining with Annexin-V – PI dye in flow cytometry. Q13-LL Live cell, Q13-UL Necrosis, Q13-LR Early Apoptosis, Q13-UR Late Apoptosis.