. 2024 Jun 28;18(3):133–145. doi: 10.2478/abm-2024-0019

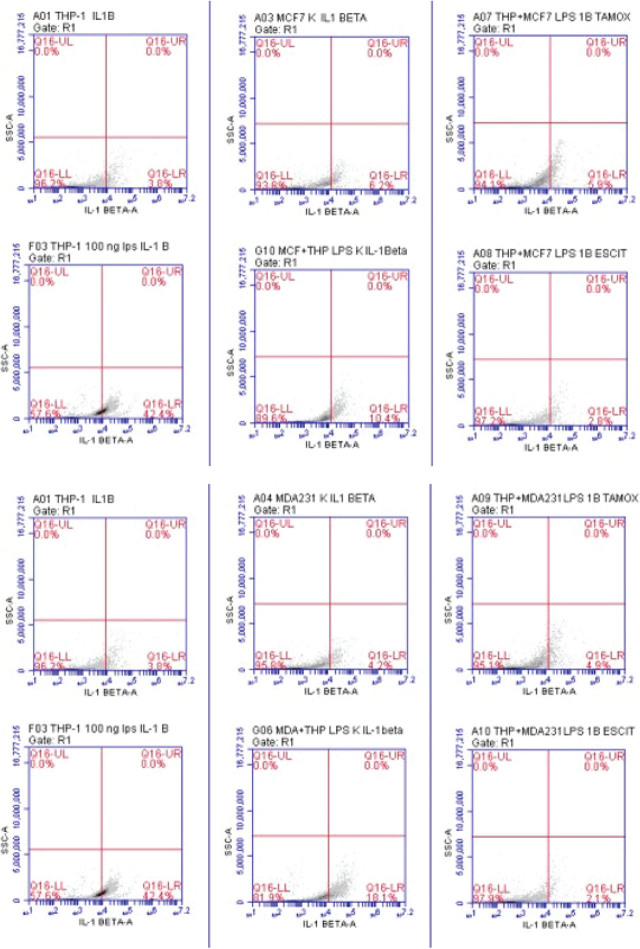
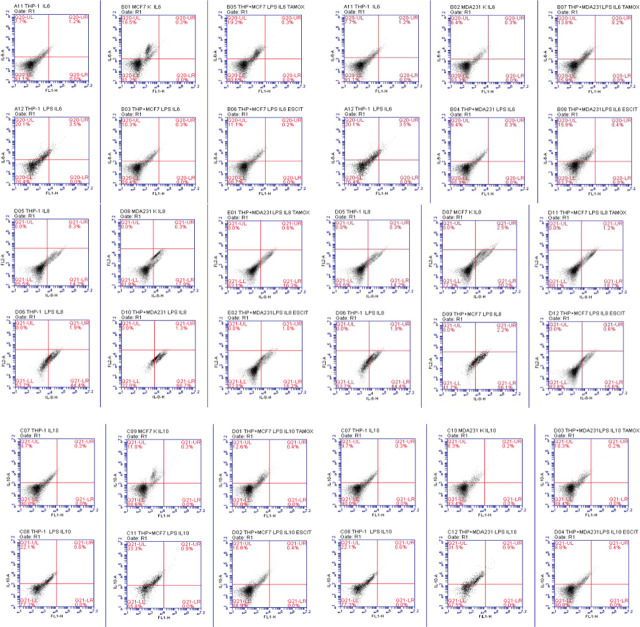
Figure 4.

Flow cytometry scatter plots showing IL-1 Beta expression in THP-1, MCF-7, and MDA-MB-231 cells, with and without treatments of LPS, IL-1 Beta, Tamoxifen, and Escitalopram Oxalate. Flow cytometry scatter plots showing IL-6 and IL-10 expression in THP-1, MCF-7, and MDA-MB-231 cells with various treatments including LPS, IL-6, IL-10, Tamoxifen, and Escitalopram Oxalate. The image consists of multiple scatter plots (3x4 grid) representing flow cytometry data for IL-1 Beta expression across different cell lines (THP-1, MCF-7, and MDA-MB-231) treated with various conditions including LPS, IL-1 Beta, Tamoxifen, and Escitalopram Oxalate. Each scatter plot is divided into quadrants representing different cell populations, with a specific focus on IL-1 Beta expression. **Top Row:** 1. **A01 THP-1 IL1B**: A control sample for THP-1 cells treated with IL-1 Beta, showing minimal IL-1 Beta expression in the Q16-UR quadrant (0.0%). 2. **A03 MCF-7 IL1B**: MCF-7 cells treated with IL-1 Beta, also showing negligible IL-1 Beta expression (0.0% in Q16-UR). 3. **A07 THP + MCF7 LPS IL1B Tamox**: Cells treated with LPS, IL-1 Beta, and Tamoxifen, with no detectable IL-1 Beta expression (Q16-UR, 0.0%). **Middle Row:** 1. **F03 THP-1 100ng LPS IL1B**: THP-1 cells treated with 100ng LPS and IL-1 Beta, with no observable IL-1 Beta expression (Q16-UR, 0.0%). 2. **G10 MCF + THP LPS IL1B**: Mixed MCF and THP-1 cells treated with LPS and IL-1 Beta, showing no detectable expression of IL-1 Beta (Q16-UR, 0.0%). 3. **A08 THP + MCF7 LPS IL1B Escit**: Similar combination as A07 but with Escitalopram, again with no IL-1 Beta expression in Q16-UR (0.0%). **Bottom Row:** 1. **A01 THP-1 IL1B (Replicate)**: Similar to the first plot, showing 1.2% IL-1 Beta expression in the lower right quadrant (Q16-LR). 2. **A04 MDA231 K IL1B**: MDA-MB-231 cells treated with IL-1 Beta, also showing negligible IL-1 Beta expression. 3. **A09 THP + MDA231 LPS IL1B Tamox**: Co-treatment of THP-1 and MDA-MB-231 cells with LPS, IL-1 Beta, and Tamoxifen, showing no IL-1 Beta expression in Q16-UR (0.0%). Each plot highlights a focus on the lower quadrants (Q16-LL and Q16-LR), representing live cells with minimal IL-1 Beta expression in most treatment conditions. The image contains a grid of 6x5 flow cytometry scatter plots showing the expression of IL-6 and IL-10 across different cell types (THP-1, MCF-7, and MDA-MB-231), treated with LPS, IL-6, IL-10, Tamoxifen, and Escitalopram Oxalate. The plots are divided by quadrants, representing different populations of cells and cytokine expression levels. **Top Three Rows (IL-6 Expression)**: 1. **A11 THP-1 IL6** to **D06 THP-1 IL6**: - These plots show IL-6 expression in THP-1 and MCF-7 cells treated with various conditions, including LPS, IL-6, Tamoxifen, and Escitalopram Oxalate. - Cells treated with IL-6 (e.g., A11, A12, and A17) show minimal IL-6 expression in the upper-right quadrant (Q21-UR). - Co-treatments with LPS and Tamoxifen, or LPS and Escitalopram, show slight variations in IL-6 expression but remain mostly clustered in the lower quadrants, indicating low IL-6 expression. **Bottom Three Rows (IL-10 Expression)**: 1. **C07 THP-1 IL10** to **D04 THP-1 IL10**: - These plots focus on IL-10 expression under similar treatments (LPS, IL-10, Tamoxifen, and Escitalopram Oxalate). - The upper-right quadrants (Q21-UR) represent the fraction of cells expressing IL-10, which remains low across most treatments, with slight increases in certain conditions (e.g., C08, C12). - Co-treatments with Tamoxifen and Escitalopram again show minimal effect on IL-10 expression in both cell types. Overall, the scatter plots indicate low levels of IL-6 and IL-10 expression under these experimental conditions, with little variation in the upper-right quadrants (Q21-UR) across the different treatments.

Flow cytometry scatter plots showing IL-1 Beta expression in THP-1, MCF-7, and MDA-MB-231 cells, with and without treatments of LPS, IL-1 Beta, Tamoxifen, and Escitalopram Oxalate. Flow cytometry scatter plots showing IL-6 and IL-10 expression in THP-1, MCF-7, and MDA-MB-231 cells with various treatments including LPS, IL-6, IL-10, Tamoxifen, and Escitalopram Oxalate. The image consists of multiple scatter plots (3x4 grid) representing flow cytometry data for IL-1 Beta expression across different cell lines (THP-1, MCF-7, and MDA-MB-231) treated with various conditions including LPS, IL-1 Beta, Tamoxifen, and Escitalopram Oxalate. Each scatter plot is divided into quadrants representing different cell populations, with a specific focus on IL-1 Beta expression. **Top Row:** 1. **A01 THP-1 IL1B**: A control sample for THP-1 cells treated with IL-1 Beta, showing minimal IL-1 Beta expression in the Q16-UR quadrant (0.0%). 2. **A03 MCF-7 IL1B**: MCF-7 cells treated with IL-1 Beta, also showing negligible IL-1 Beta expression (0.0% in Q16-UR). 3. **A07 THP + MCF7 LPS IL1B Tamox**: Cells treated with LPS, IL-1 Beta, and Tamoxifen, with no detectable IL-1 Beta expression (Q16-UR, 0.0%). **Middle Row:** 1. **F03 THP-1 100ng LPS IL1B**: THP-1 cells treated with 100ng LPS and IL-1 Beta, with no observable IL-1 Beta expression (Q16-UR, 0.0%). 2. **G10 MCF + THP LPS IL1B**: Mixed MCF and THP-1 cells treated with LPS and IL-1 Beta, showing no detectable expression of IL-1 Beta (Q16-UR, 0.0%). 3. **A08 THP + MCF7 LPS IL1B Escit**: Similar combination as A07 but with Escitalopram, again with no IL-1 Beta expression in Q16-UR (0.0%). **Bottom Row:** 1. **A01 THP-1 IL1B (Replicate)**: Similar to the first plot, showing 1.2% IL-1 Beta expression in the lower right quadrant (Q16-LR). 2. **A04 MDA231 K IL1B**: MDA-MB-231 cells treated with IL-1 Beta, also showing negligible IL-1 Beta expression. 3. **A09 THP + MDA231 LPS IL1B Tamox**: Co-treatment of THP-1 and MDA-MB-231 cells with LPS, IL-1 Beta, and Tamoxifen, showing no IL-1 Beta expression in Q16-UR (0.0%). Each plot highlights a focus on the lower quadrants (Q16-LL and Q16-LR), representing live cells with minimal IL-1 Beta expression in most treatment conditions. The image contains a grid of 6x5 flow cytometry scatter plots showing the expression of IL-6 and IL-10 across different cell types (THP-1, MCF-7, and MDA-MB-231), treated with LPS, IL-6, IL-10, Tamoxifen, and Escitalopram Oxalate. The plots are divided by quadrants, representing different populations of cells and cytokine expression levels. **Top Three Rows (IL-6 Expression)**: 1. **A11 THP-1 IL6** to **D06 THP-1 IL6**: - These plots show IL-6 expression in THP-1 and MCF-7 cells treated with various conditions, including LPS, IL-6, Tamoxifen, and Escitalopram Oxalate. - Cells treated with IL-6 (e.g., A11, A12, and A17) show minimal IL-6 expression in the upper-right quadrant (Q21-UR). - Co-treatments with LPS and Tamoxifen, or LPS and Escitalopram, show slight variations in IL-6 expression but remain mostly clustered in the lower quadrants, indicating low IL-6 expression. **Bottom Three Rows (IL-10 Expression)**: 1. **C07 THP-1 IL10** to **D04 THP-1 IL10**: - These plots focus on IL-10 expression under similar treatments (LPS, IL-10, Tamoxifen, and Escitalopram Oxalate). - The upper-right quadrants (Q21-UR) represent the fraction of cells expressing IL-10, which remains low across most treatments, with slight increases in certain conditions (e.g., C08, C12). - Co-treatments with Tamoxifen and Escitalopram again show minimal effect on IL-10 expression in both cell types. Overall, the scatter plots indicate low levels of IL-6 and IL-10 expression under these experimental conditions, with little variation in the upper-right quadrants (Q21-UR) across the different treatments.

IL-1β, IL-6, IL-8, IL-10 and TNF-α levels in the MCF-7 and MDA-MB-231 co-culture model. Q16-LR amount of secreted IL-1β, Q20-IL amount of secreted IL-6, Q20-UL amount of secreted TNF-α, Q21-LR amount of secreted IL-8, and Q21-UL amount of secreted IL-10. IL, interleukin.