FIGURE 1.

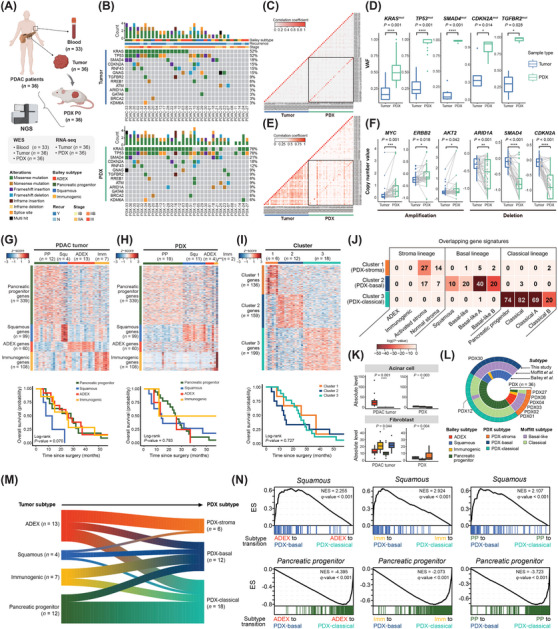
Integrative genomic analysis to demonstrate clonal evolution and subtype transition in PDX models of PDAC. (A) Blood and primary tumors were collected from 36 patients diagnosed with PDAC. PDX models were established by engrafting obtained primary tumors under mice skin. Samples collected from humans and mice (P0) were subjected to NGS for genomic and transcriptomic analyses. Somatic mutations were analyzed using WES data of the 33 blood‐matched tumor samples. (B) Clinical information and mutation profile of the PDAC‐associated genes were visualized in mutation landscapes of primary tumor and PDX. Each column corresponds to the patient‐matched primary/PDX tumor samples. (C) Pairwise Pearson's correlation coefficients were calculated from VAFs of highly mutated genes. Diagonal elements within the black‐lined square in the heatmap indicate correlations between patient‐matched samples. (D) VAFs of PDAC‐associated genes were compared between primary tumor and PDX. Statistical significance was determined using Student's t‐test (*P ≤ 0.05, ****P ≤ 0.0001). (E) Pearson correlation coefficients for all pairwise combinations were measured using the copy numbers of protein‐coding genes. (F) Copy number changes were compared between primary tumors and PDX using gene‐specific CNV values calculated using GISTIC analysis. Dots connected with lines within the boxplots indicate the patient‐matched samples. Statistical significance was determined through t‐test (*P ≤ 0.05, **P ≤ 0.01, ***P ≤ 0.001, ****P ≤ 0.0001). Using RNA sequencing (RNA‐seq) data of (G) primary tumors (n = 36) and (H) PDX (n = 36), consensus clustering based on normalized expression levels for Bailey gene signatures was conducted. Survival analysis of patients according to Bailey subtypes was performed for primary tumors and PDX, respectively. Results were visualized with Kaplan‐Meier plot. (I) Gene signatures of three clusters and the candidates for PDX subtypes were defined based on the gene expression profile of PDX (log2 fold change > 1 or < ‐1, P‐value ≤ 0.01). Consensus clustering based on the expression level of gene signatures was conducted and visualized as a heatmap. Survival analysis of patients according to three candidates for PDX subtypes was performed. (J) Gene signatures of PDAC PDX subtypes defined in this study were compared to those of PDAC subtypes previously reported by Moffitt et al. [4], Bailey et al. [5], and Chan‐Seng‐Yue et al. [6]. The number of overlapping genes and statistical significance were calculated. (K) Proportion of acinar cells and fibroblasts identified by deconvolution analysis using PDAC single‐cell RNA sequencing (scRNA‐seq) data (*P ≤ 0.05, **P ≤ 0.01, ****P ≤ 0.0001). (L) Subtypes of 36 PDX samples by classification methods were visualized as a Circos plot. Gene signatures from Hyun et al. (present study), Moffitt et al. [4], and Bailey et al. [5] were applied for PDX subtyping. Patient IDs were indicated for PDX samples with lineage discrepancies between subtyping methods. (M) Primary tumors were classified in Bailey subtypes and PDX were classified into three novel subtypes. Changes in subtypes between patient‐matched primary tumors and PDX were visualized as a riverplot. Width of the river stem between the tumor and PDX subtypes was proportional to the number of samples. (N) Representative results of GSEA using Bailey gene signatures were shown. Primary tumors were divided into subgroups as subtype transitions. ES for each gene set was computed from the gene ranking list of the subgroups. The gene set used is indicated at the top of the result plots. Among the primary tumors (n = 36), squamous subtypes (n = 4) were excluded in GSEA because these small numbers of subtypes diverged into PDX subtypes, resulting in too few samples to conduct a statistical test. Abbreviations: ADEX, aberrantly differentiated endocrine exocrine; CNV, copy number variation; ES, enrichment score; GISTIC, genomic identification of significant targets in cancer; GSEA, gene set enrichment analysis; Imm, Immunogenic; N, no; NES, normalized enrichment score; NGS, next‐generation sequencing; PDAC, pancreatic ductal adenocarcinoma; PDX, patient‐derived xenograft; PP, pancreatic progenitor; Recur, recurrence; RNA‐seq, RNA sequencing; scRNA‐seq, single‐cell RNA sequencing; Squ, Squamous; VAFs, variant allele frequencies; WES, whole‐exome sequencing; Y, yes.
