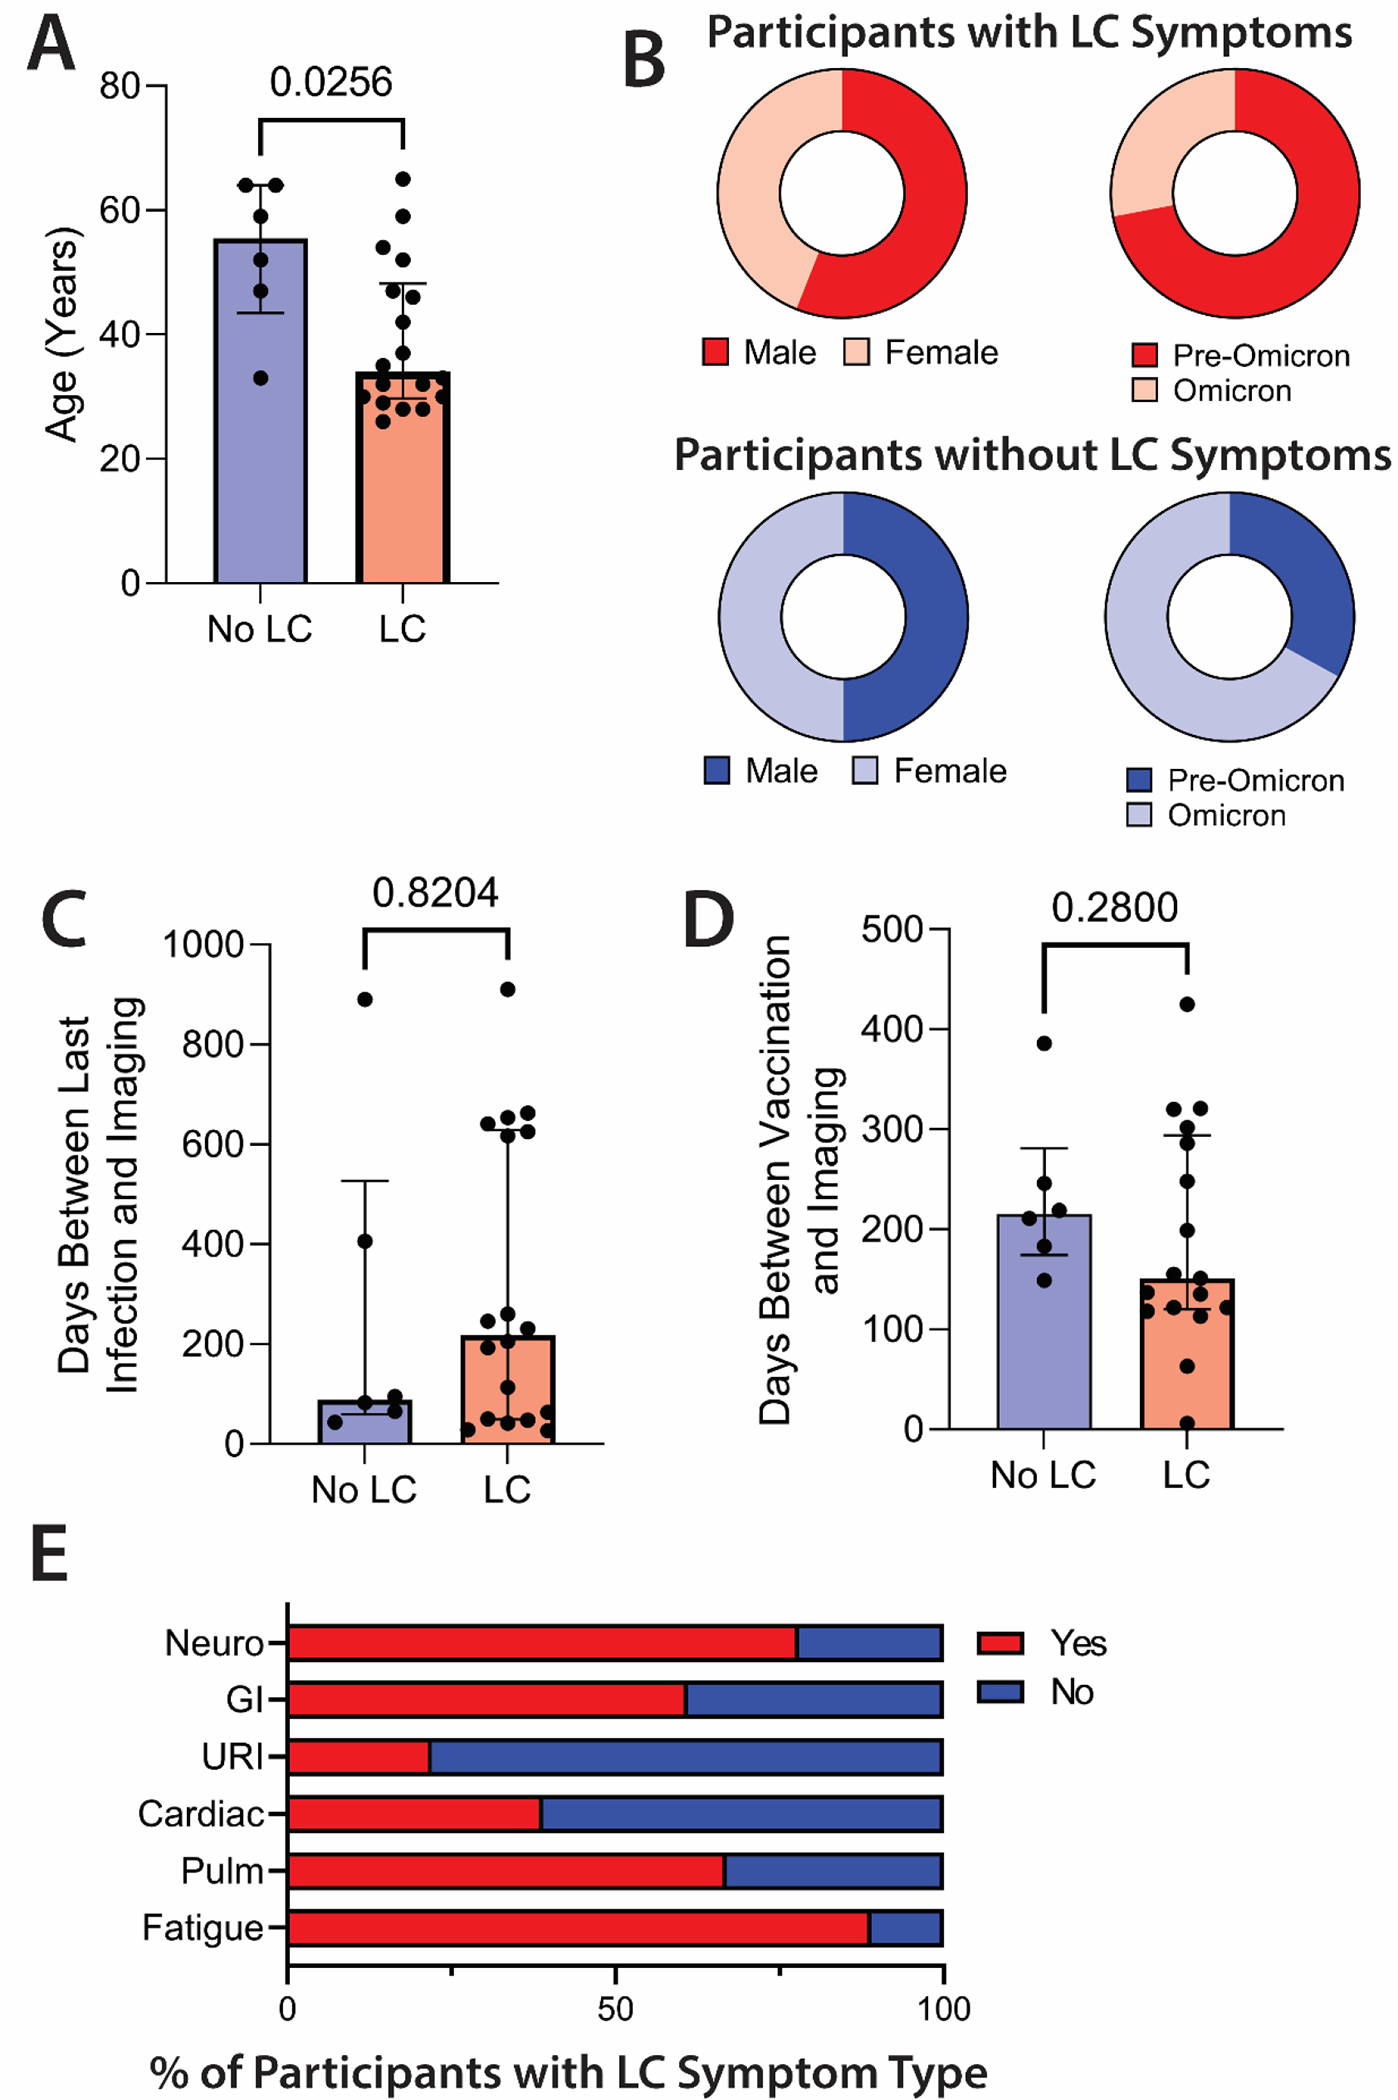
Figure 1. COVID-19 PET imaging cohort demographics and clinical characteristics.

(A and B) Comparisons in age (A), sex assigned at birth, and variant wave (B) are shown in those with (n=18) and without LC (n=6). (C and D) The days between last documented SARS-CoV-2 infection and PET imaging (C) and last COVID-19 vaccine dose and PET imaging (D) are shown for participants with and without LC. (E) Shown are the percent of participants with and without specific LC symptoms phenotype. LC, Long COVID; GI, gastrointestinal; URI, upper respiratory infection symptoms; Pulm, pulmonary symptoms. Bars represent median values with all individual data points and interquartile ranges shown. P values were calculated by two-sided non-parametric Mann-Whitney tests.
