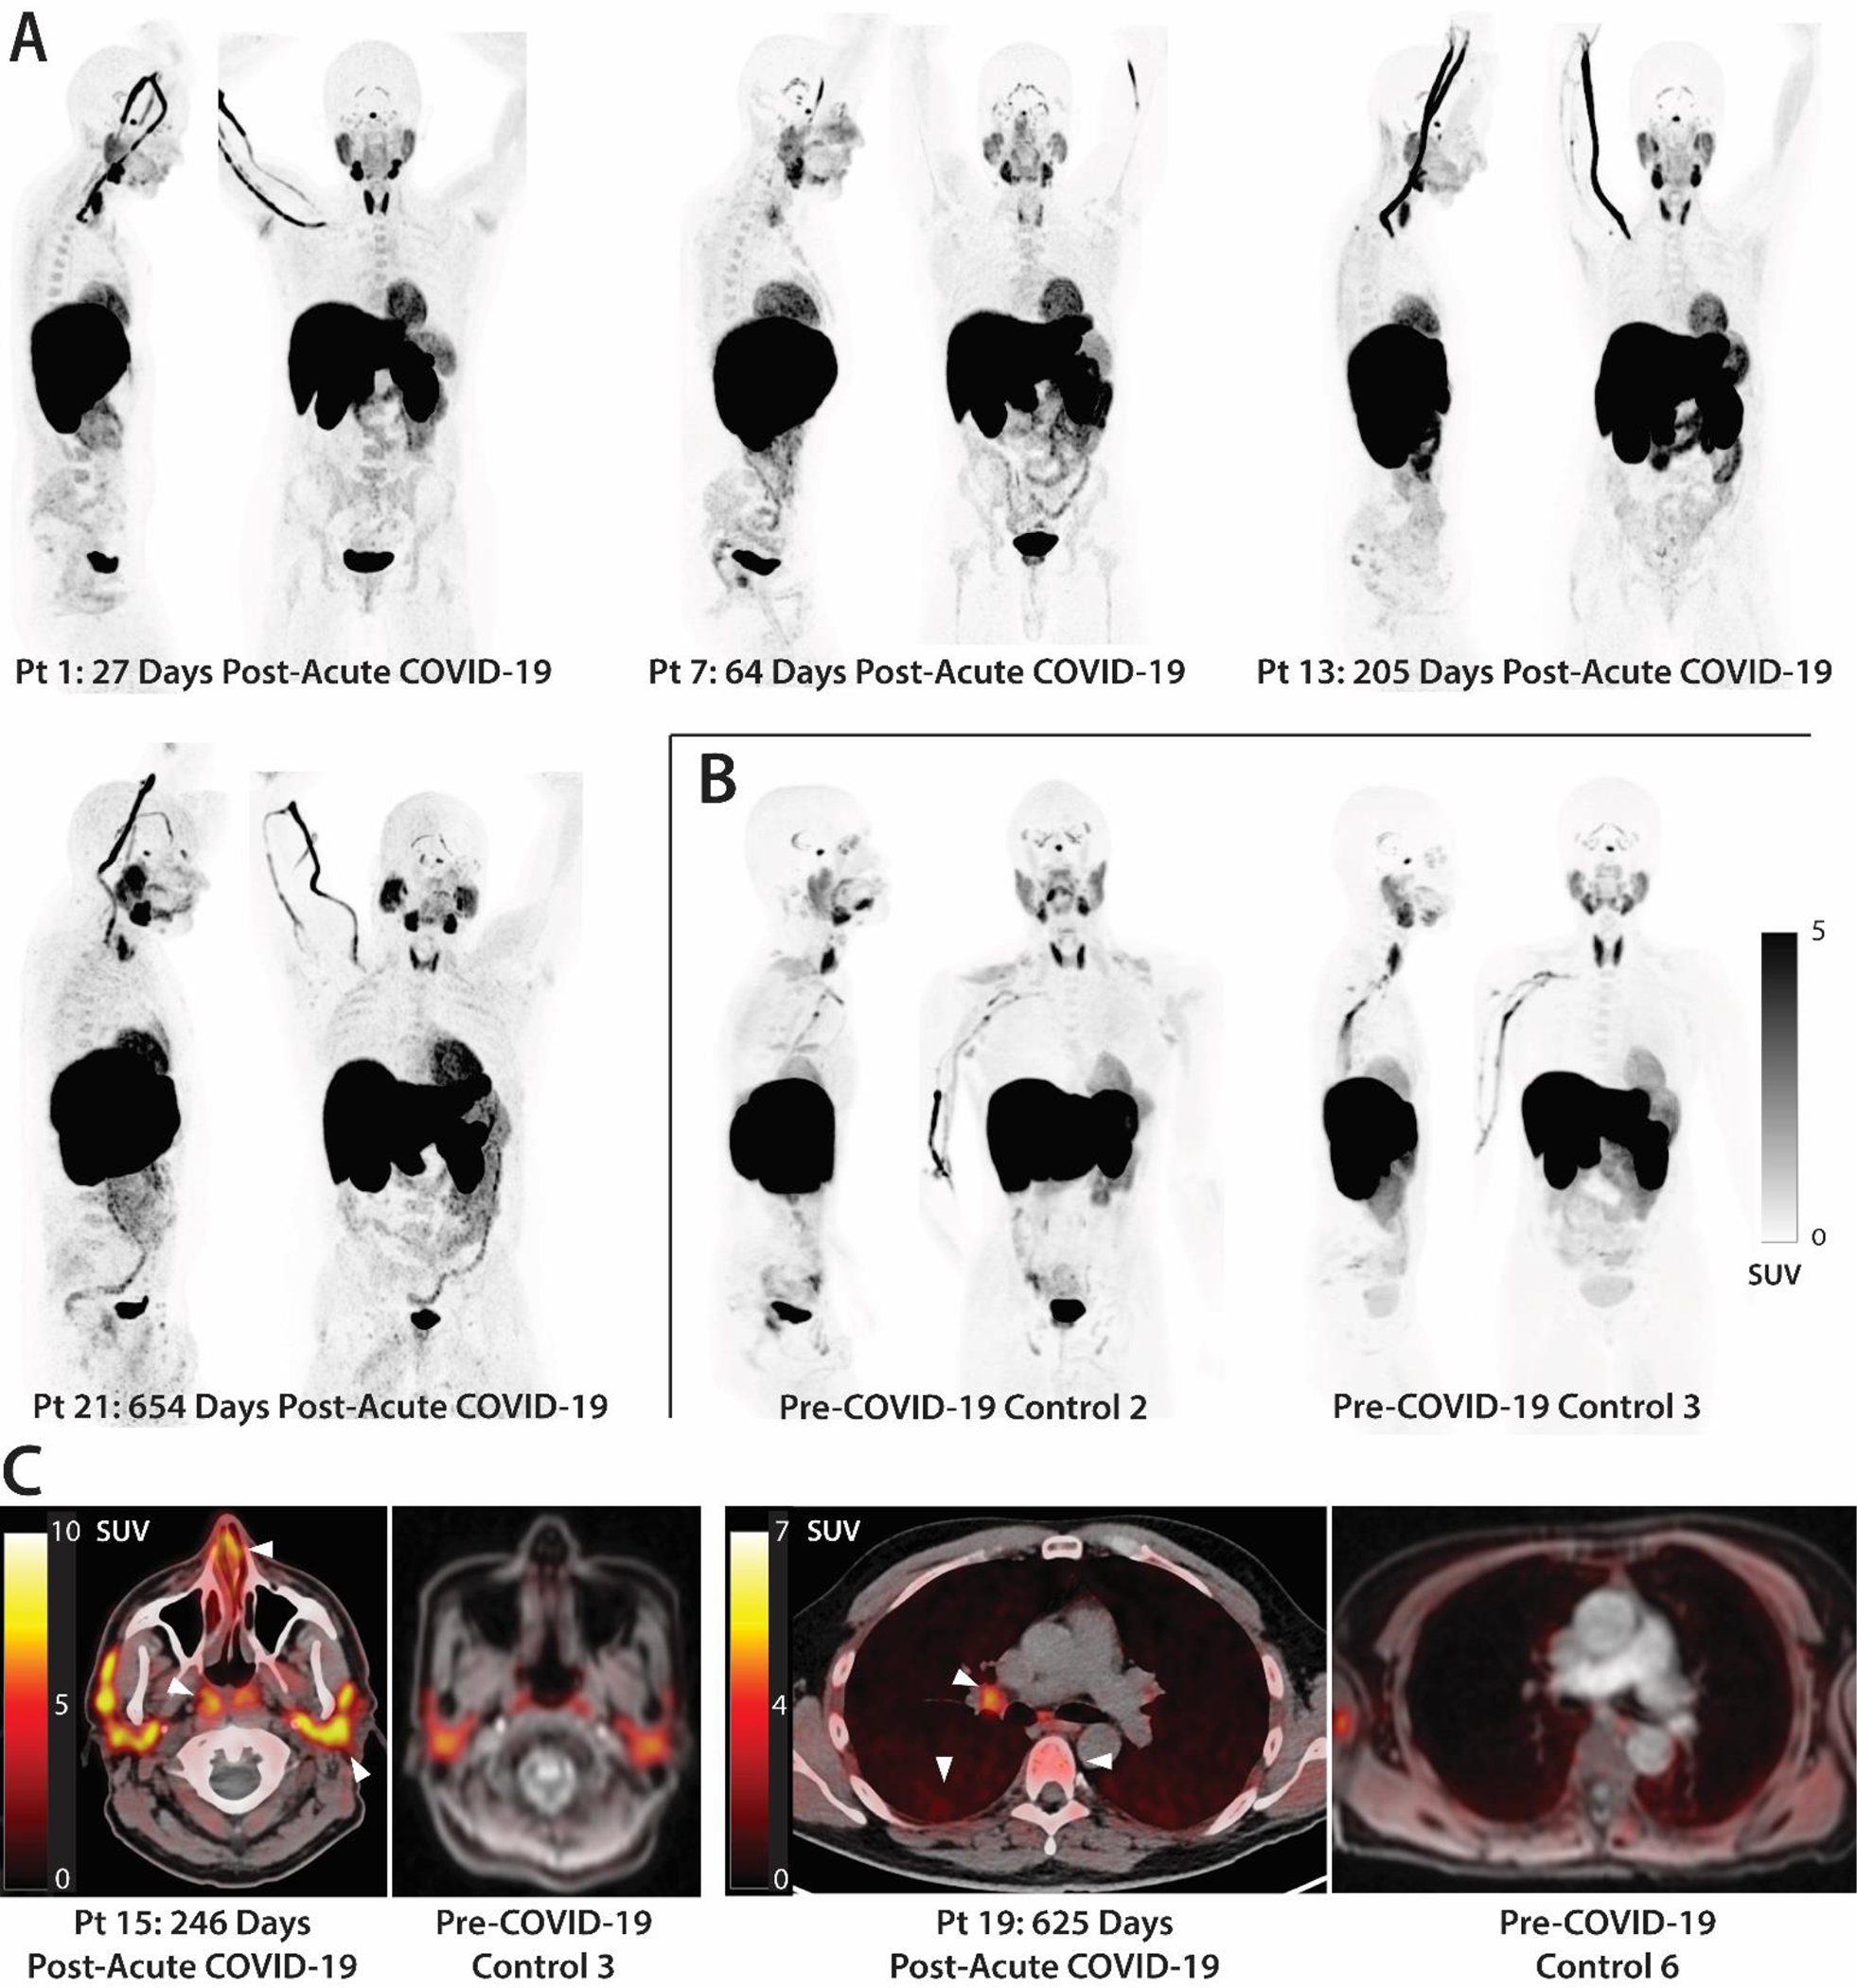
Figure 2. Increased [18F]F-AraG uptake in participants following COVID-19 compared to pre-pandemic control volunteers.

(A and B) Maximum intensity projections (MIP; coronal and sagittal views of 3-dimesional reconstructions) are shown for four representative participants at various times following SARS-CoV-2 infection (A) and male and female uninfected controls (B). (C) Axial PET/CT overlay images show signal in nasal turbinates, parotid glands, tonsillar tissue, hilar lymph node, lung parenchyma, and lumbar bone marrow in representative post-acute COVID-19 and control participants (white arrows). MIPs for all participants are shown in fig. S1. Pt, patient. SUV, standardized uptake value.
