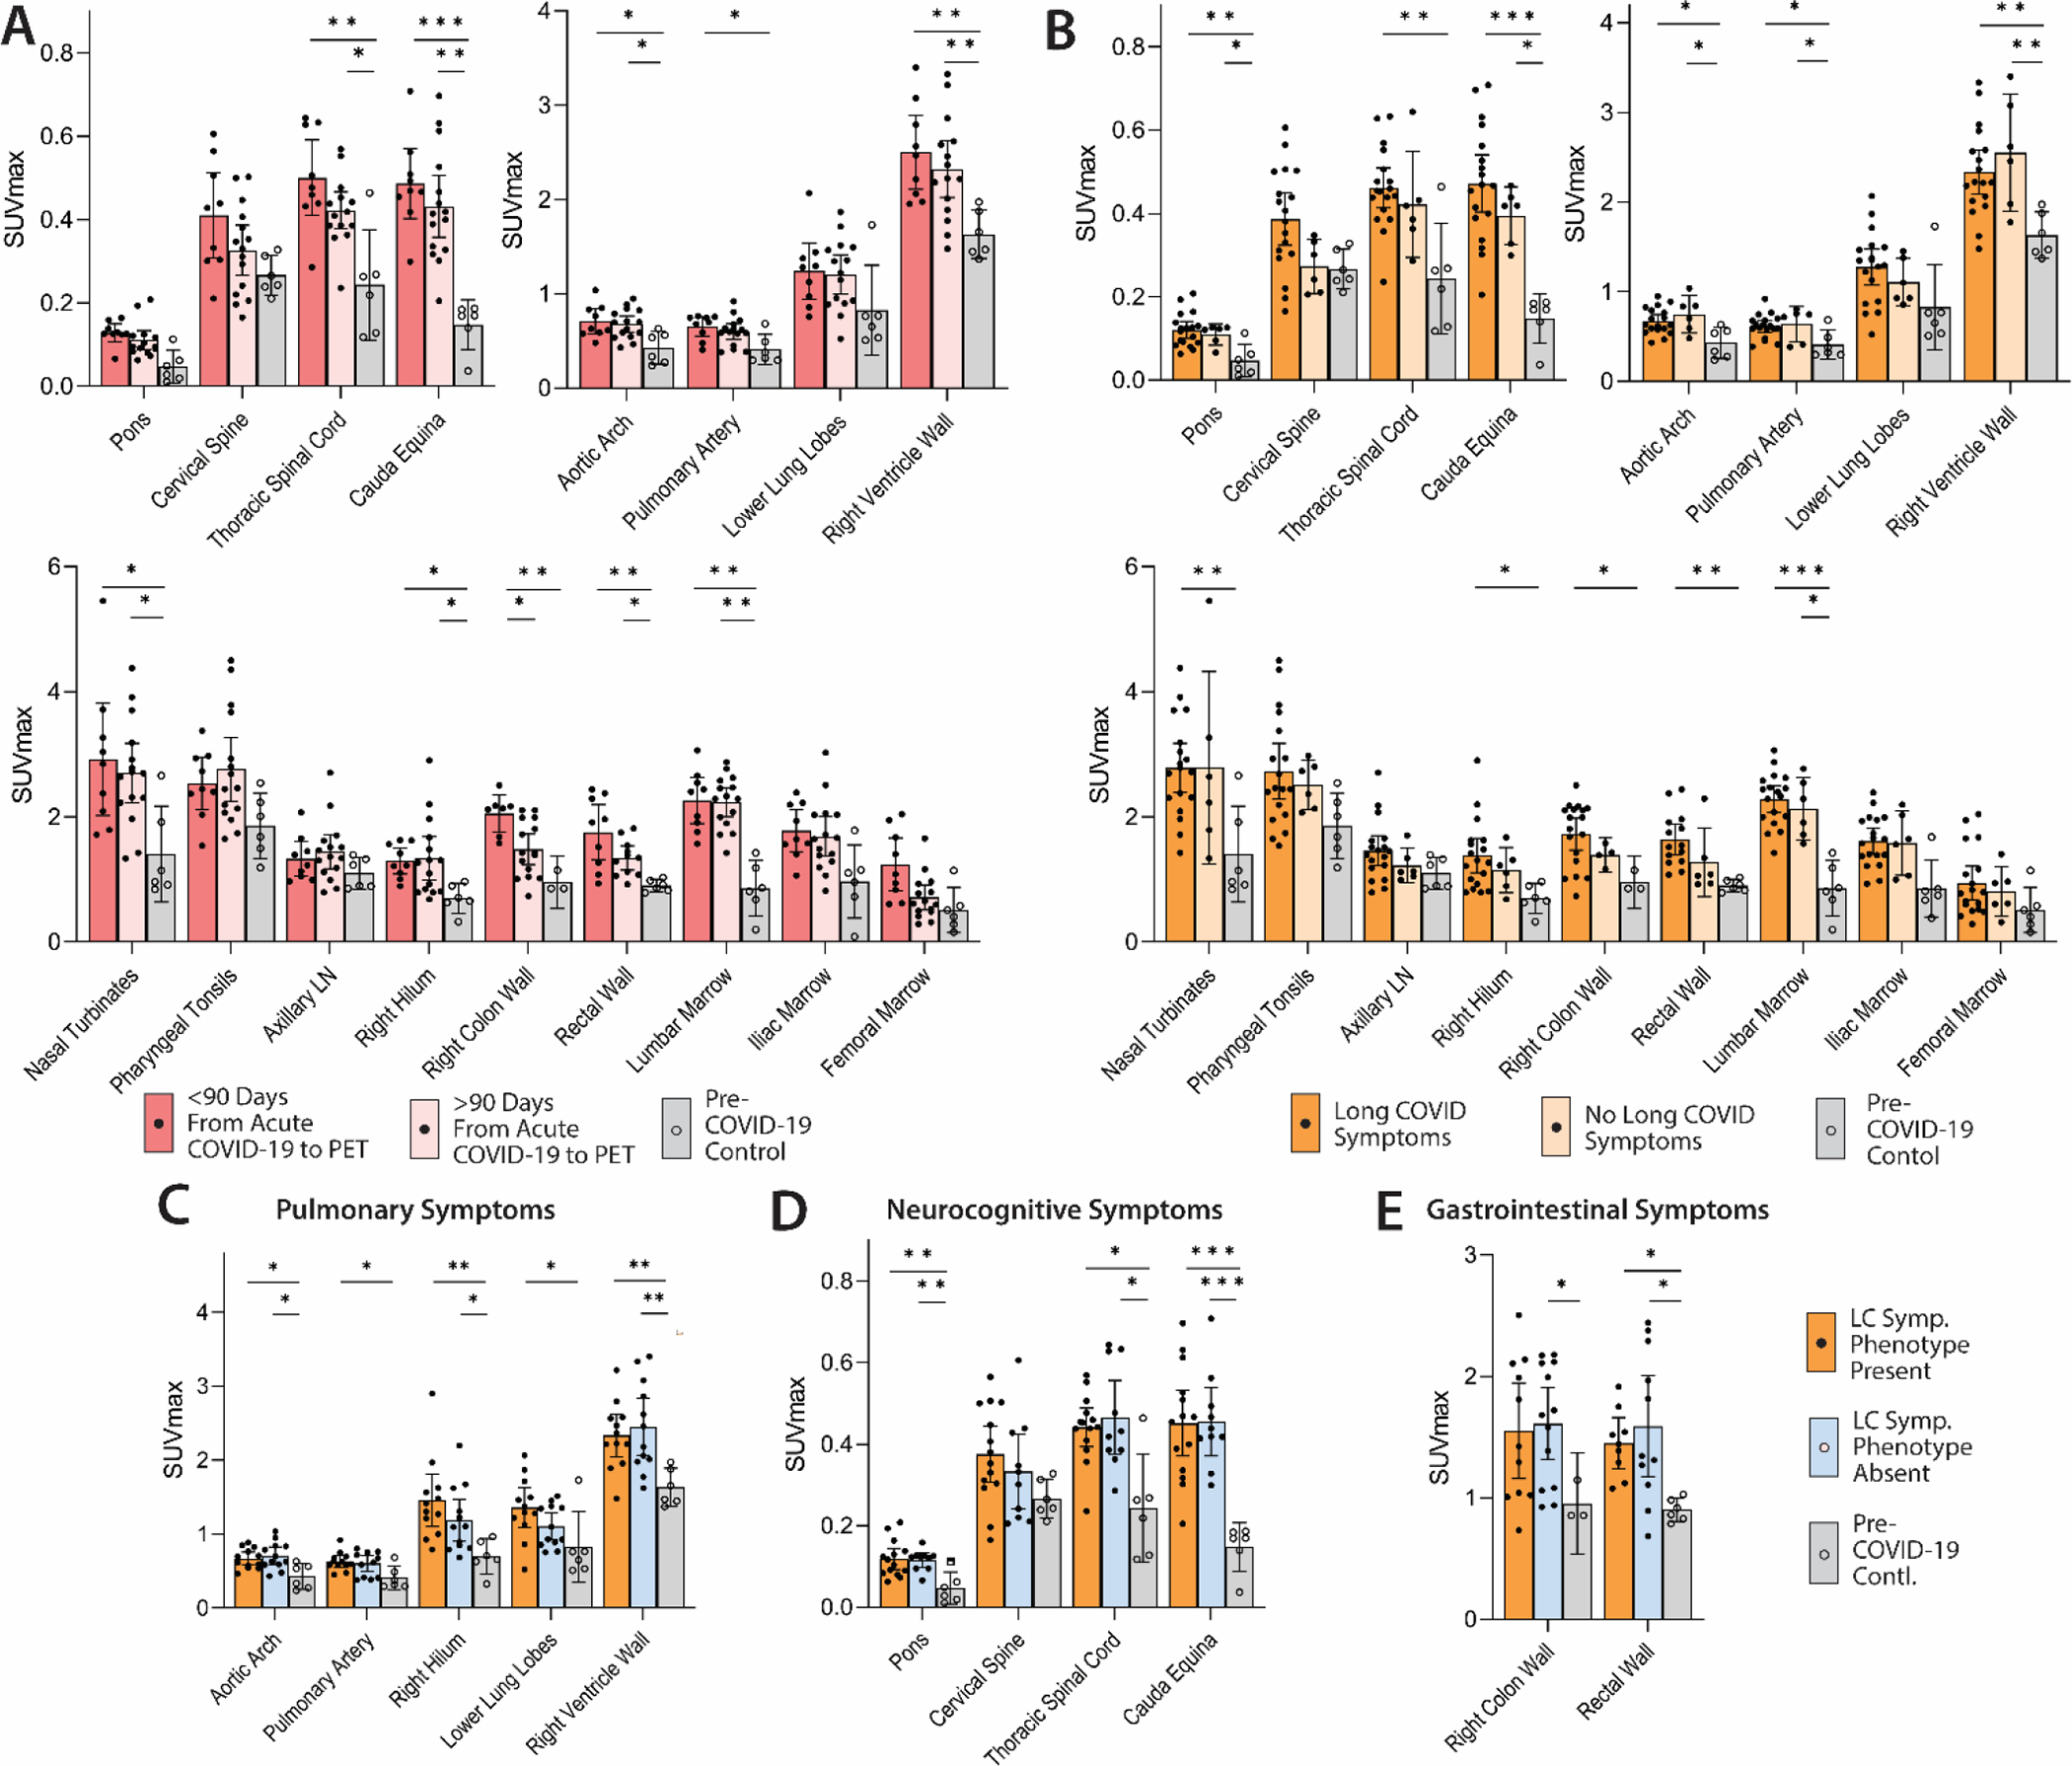
Figure 4. Differential [18F]F-AraG uptake in post-acute COVID-19 cases and control participants grouped by time from initial COVID-19 symptom onset to PET imaging and by Long COVID symptoms.

(A) SUVmax values in tissue ROIs in post-acute COVID-19 participants imaged <90 days or >90 days from acute infection onset and control volunteers are shown. (B) SUVmax values in tissue ROIs in post-acute COVID-19 participants with or without Long COVID symptoms reported at the time of imaging and control volunteers are shown in. (C to E) SUVmax values in tissue ROIs in post-acute COVID-19 participants with or without pulmonary symptoms (C), neurocognitive symptoms (D) and gastrointestinal symptoms (E) are also shown. Bars represent mean SUVmax and error bars represent 95% confidence interval. Adjusted P values <0.05, <0.01 and <0.001 represented by *, **, and *** respectively from two-sided non-parametric Kruskal–Wallis tests using a Benjamini-Hochberg adjustment for false discovery rates across multiple comparisons (q value = adjusted P). All data points are shown. SUVmean values are shown in fig. S4.
