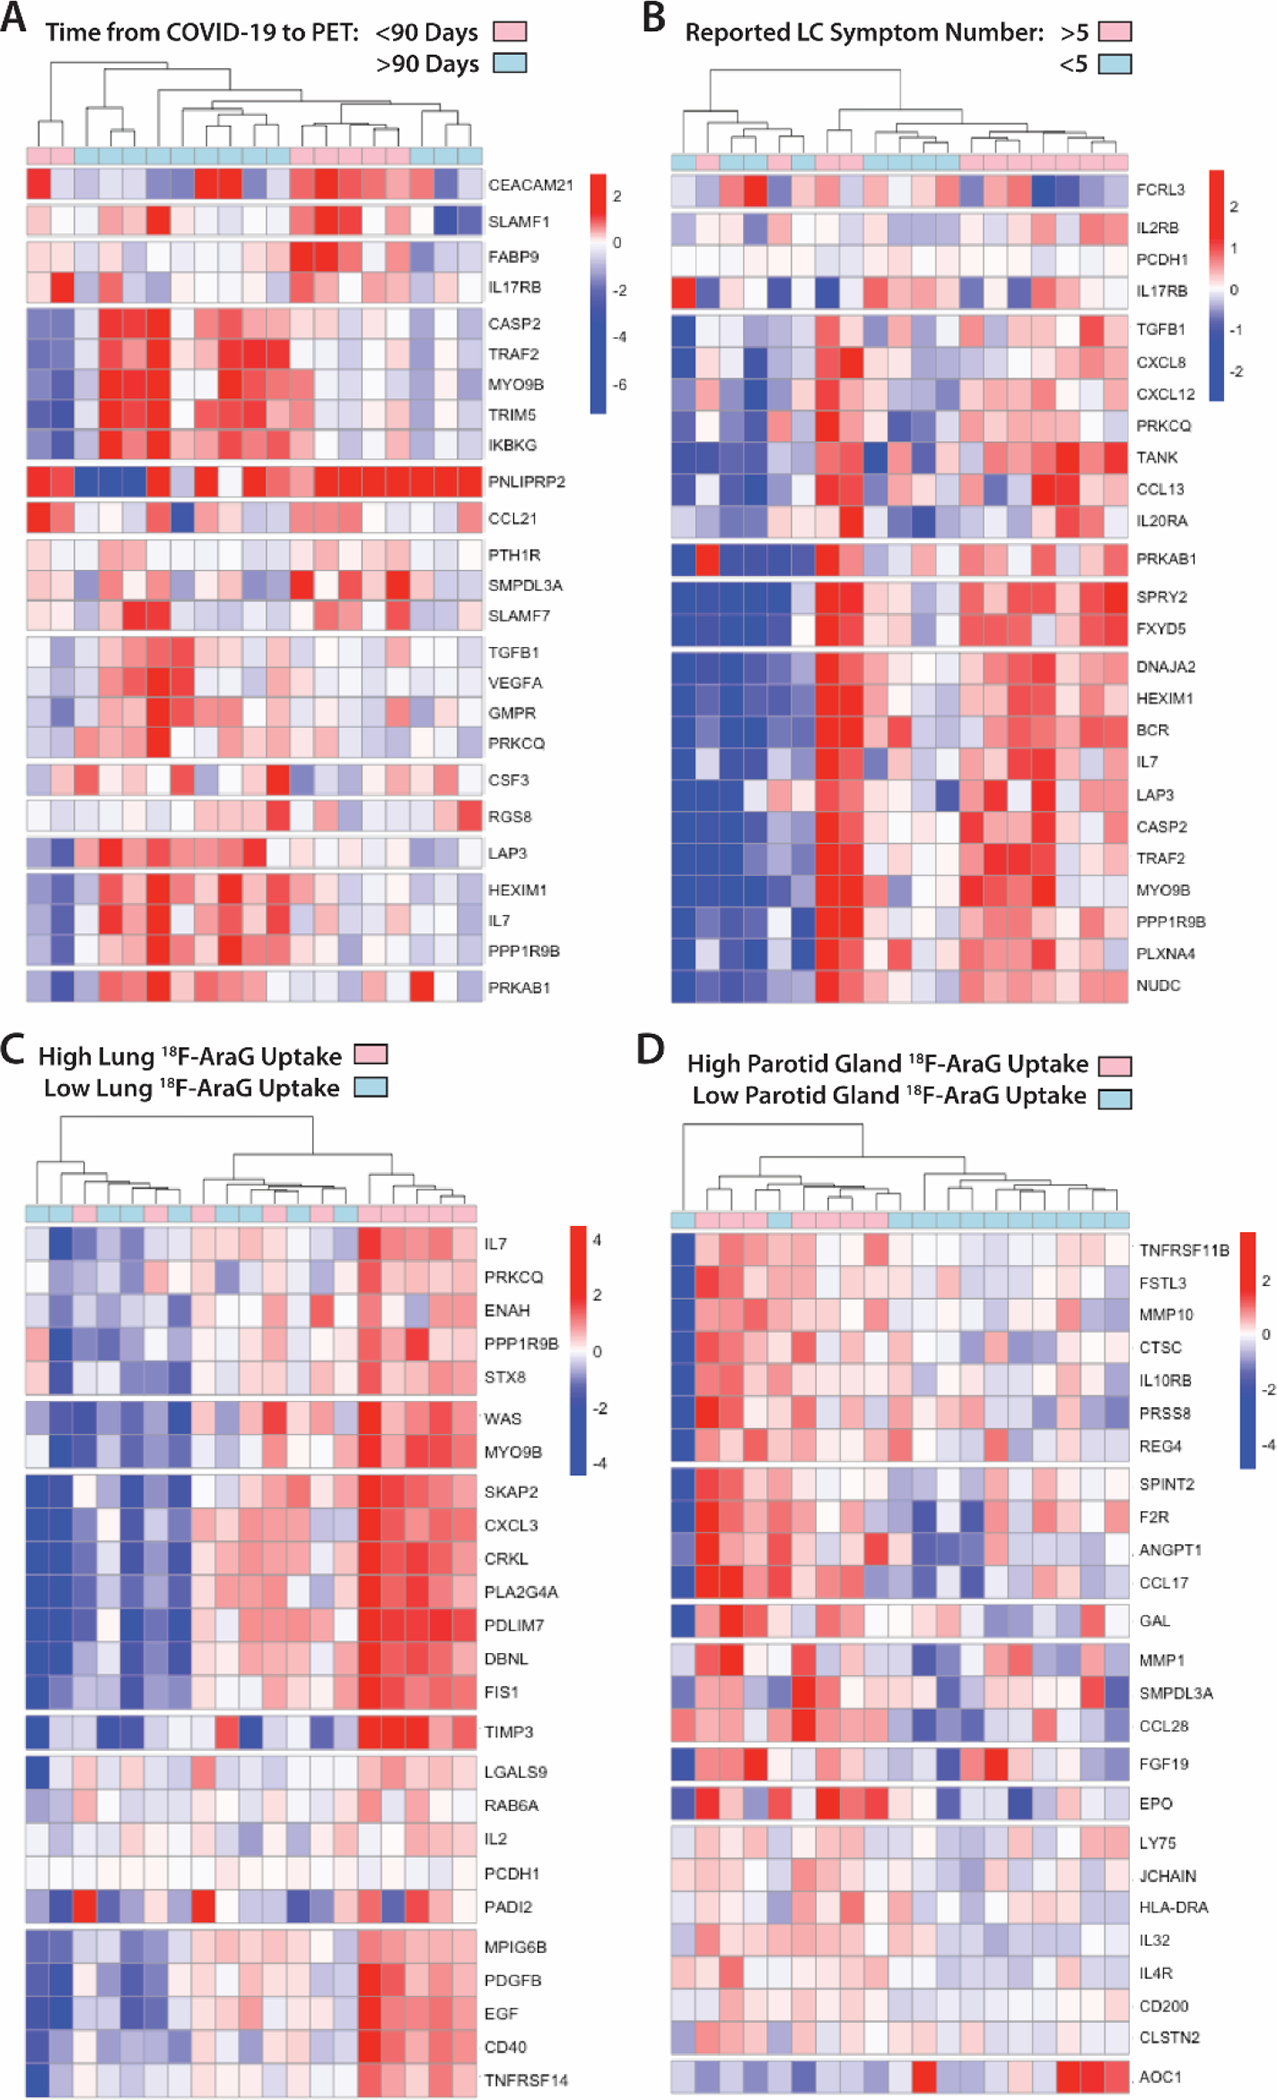
Figure 5. Modules of circulating markers of inflammation and immune activation are associated with reported Long COVID symptom number and [18F]F-AraG PET uptake in representative tissues.

(A to D) Clustered heat maps of the top 25 differentially expressed plasma proteins from Olink Proximity Extension Assay EXPLORE 384 panel based on unadjusted P values with markers grouped into k-clusters based on similarity are shown for participants imaged early (<90 days) or later (>90 days) after symptom onset (A), those reporting >5 or ≤5 Long COVID symptoms (out of a total of 32 surveyed across multiple organ systems) at the time of PET imaging (B), and in those with high lower lung lobe [18F]F-AraG uptake (C; defined as SUVmax >2 standard deviations [SD] above the average SUVmax value measured in Pre-pandemic control volunteers), and parotid gland tissue [18F]F-AraG uptake (D; defined as SUVmax >1 SD above the average SUVmax value measured in pre-pandemic control participants). Heat maps clustered by high uptake in other tissues ROIs are shown in fig. S8. Scale bars represent mean subtracted normalized log2 protein expression values.
