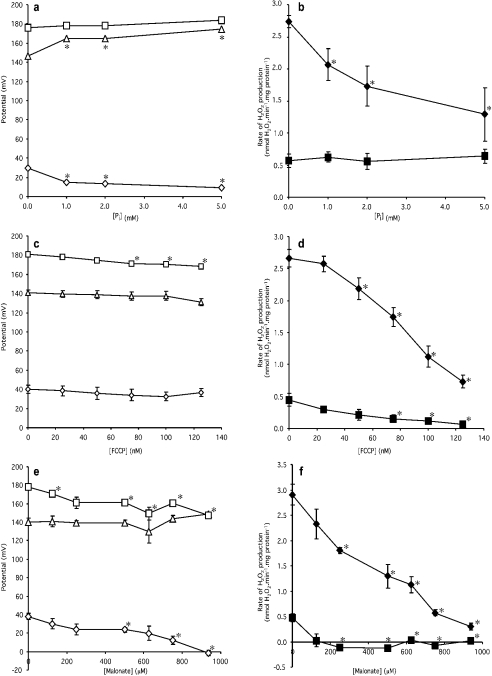
Figure 2. Effects of phosphate, FCCP and malonate on the components of Δp and on the H2O2 production rate.
Incubation conditions were the same as those described in the legend to Figure 1(a). Open symbols (a,c,e) represent potentials (squares, Δp; triangles, Δψ; diamonds, ΔpH). Closed symbols (b,d,f) represent H2O2 production rate (squares, 100 nM nigericin present; diamonds, nigericin absent). Data points represent means±S.E.M. for measurements on four to six separate mitochondrial preparations. Phosphate (Pi) was added as KH2PO4 and malonate was added as the K+ salt. *Significant (P<0.05) difference from the datum point at zero concentration of Pi/FCCP/malonate for each respective panel.

