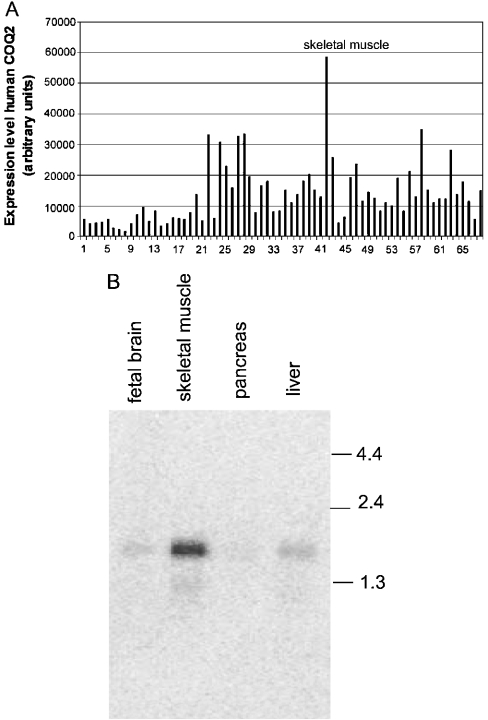
Figure 2. The expression profile analysis of hCOQ2 gene in various human tissues.
(A) Multiple tissue expression dot-blot analysis of hCOQ2. The background signal was 10373 arbitrary units and it has been subtracted from all results. The human tissues tested are: 1, whole brain; 2, cerebral cortex; 3, frontal lobe; 4, parietal lobe; 5, occipital lobe; 6, temporal lobe; 7, P.g. of cerebral cortex; 8, pons; 9, cerebellum left; 10, cerebellum right; 11, corpus callosum; 12, amygdala; 13, caudate nucleus; 14, hippocampus; 15, medulla oblongata; 16, putamen; 17, substantia nigra; 18, accubens nucleus; 19, thalamus; 20, pituitary gland; 21, spinal cord; 22, heart; 23, aorta; 24, atrium left; 25, atrium right; 26, ventriculum left; 27, ventriculum right; 28, interventricular septum; 29, apex of the heart; 30, oesophagus; 31, stomach; 32, duodenum; 33, jejunum; 34, ileum; 35, ileocaecum; 36, appendix; 37, colon ascending; 38, colon transverse; 39, colon descending; 40, rectum; 41, kidney; 42, skeletal muscle; 43, spleen; 44, thymus; 45, peripheral blood leucocytes; 46, lymph node; 47, bone marrow; 48, trachea; 49, lung; 50, placenta; 51, bladder; 52, uterus; 53, prostate; 54, testis; 55, ovary; 56, liver; 57, pancreas; 58, adrenal gland; 59, thyroid gland; 60, salivary glands; 61, mammary gland; 62, fetal brain; 63, fetal heart; 64, fetal kidney; 65, fetal liver; 66, fetal spleen; 67, fetal thymus; 68 fetal lung. (B) Northern-blot analysis of hCOQ2 mRNA performed on various human tissues. Each line was loaded with 2 μg of poly(A)+ RNA from a commercial source. The numbers represent size standards in kb.

