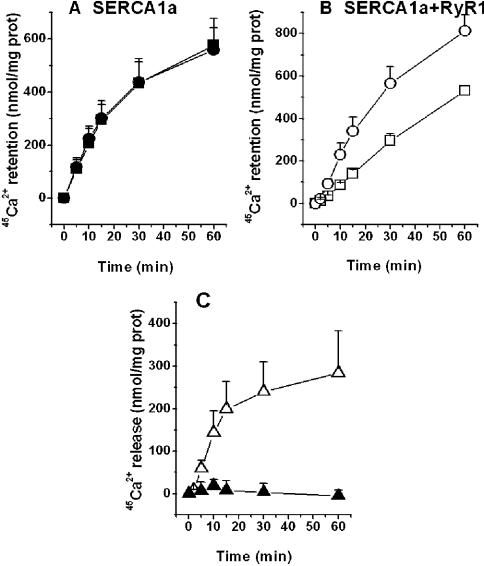
Figure 1. Time course for Ca2+ uptake and release.
Experiments were performed as described in the Experimental section, with microsomes isolated from HEK-293 cells expressing either SERCA1a alone (A) or RyR1 (B). Symbols in (A, B) represent two experimental conditions: presence (•, ○) or absence (▪, □) of 40 μM Ruthenium Red. (C) Net Ca2+ release was calculated by subtracting the amount of Ca2+ retained in the microsomes in the presence of 40 μM Ruthenium Red from the amount of Ca2+ retained in the absence of this inhibitor (results from A and B). ▴, no Ca2+ release was observed for SERCA1a alone, using results from (A); ▵, a significant amount of Ca2+ was released by RyR1, using results from (B) (n=5). Results are expressed as means±S.D.

