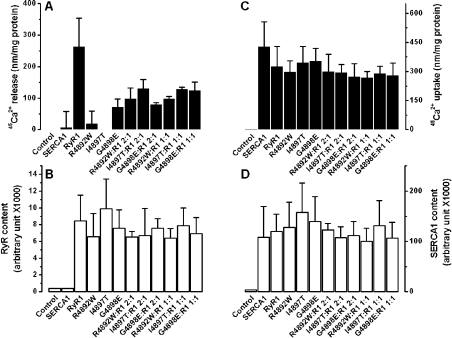
Figure 4. Reduction in peak amplitude of Ca2+-dependent Ca2+ release in the CCD mutants R4892W, I4897T and G4898E.
(A) Peak amplitudes were obtained from the maximum Ca2+ release observed at pCa 6.75–6 for the wt and homo- or heterotetrameric RyR1 mutants mainly from Figure 3. ANOVA showed a significant difference between peak amplitudes for wt and mutants (P<0.01). (B) Content of expressed wt and homo- or heterotetrameric RyR1 mutants, measured by ELISA, as described in the Experimental section. No RyR1 was detected in control HEK-293 cells transfected with pcDNA vector or cells expressing SERCA1a alone. No significant difference was obtained by ANOVA between wt and mutants (P>0.05) for peak Ca2+ uptake (C) or content of expressed SERCA1a (D) for the samples: SERCA1a alone, SERCA1a+wt RyR1 and SERCA1a+mutant RyR1. No significant differences were observed for Ca2+ uptake and SERCA1a content between control cells and those transfected with pcDNA vector. Results are expressed as means±S.D.

